Origin
With 12 trading days remaining in 2025, we wanted to revisit one of the most popular investment strategies that has broadly served investors well over the last few decades — the 60/40 portfolio. Pioneered by Harry Markowitz and his modern portfolio theory (MPT) framework in the 1950s, the 60/40 portfolio — comprised of 60% stocks and 40% bonds — argued that diversification among uncorrelated asset classes provided the investor with the most optimal portfolio allocation. Equities served as the growth engine, while bonds provided drawdown mitigation and predictable income; when combined, they should produce higher returns than stand-alone bonds and better risk-adjusted returns than stocks. The key to this strategy is the relationship between stocks and bonds — the two asset classes need to have less than perfect correlation, or better yet, be negatively correlated. In the latter scenario, this meant that if stocks were to fall, bonds would rise, limiting the overall drawdown and volatility experienced in a portfolio.
Track Record
The 60/40 portfolio was highly effective in the falling interest rate environment of the early 1980s, when rates meaningfully came down from a peak of 20%. The fall in rates led to a bull market in bonds, with the Bloomberg U.S. Aggregate Bond Index (Agg), a common proxy for fixed income performance, realizing an average annual return of near 13%. The drop in rates was also bullish for equities as borrowing costs fell, allowing corporations to boost profit margins and free up capital for growth initiatives. During this period, if one were to be invested in a domestic-only 60/40 portfolio, comprised of 60% equities (using the S&P 500 as a proxy), and 40% in the Agg, the investor would’ve realized an average annualized return of nearly 16%. While stocks and bonds both rose significantly over this period, their correlation remained low, in line with what the MPT would suggest.
This relationship largely held up in the 1990s and 2000s, with the correlation between the two asset classes remaining relatively low (below +0.5). The 60/40 portfolio provided a smoother return in a market period that experienced multiple significant expansions and contractions, such as the dot-com bubble and the Great Recession, with the average annualized return over this time frame being roughly 8%.
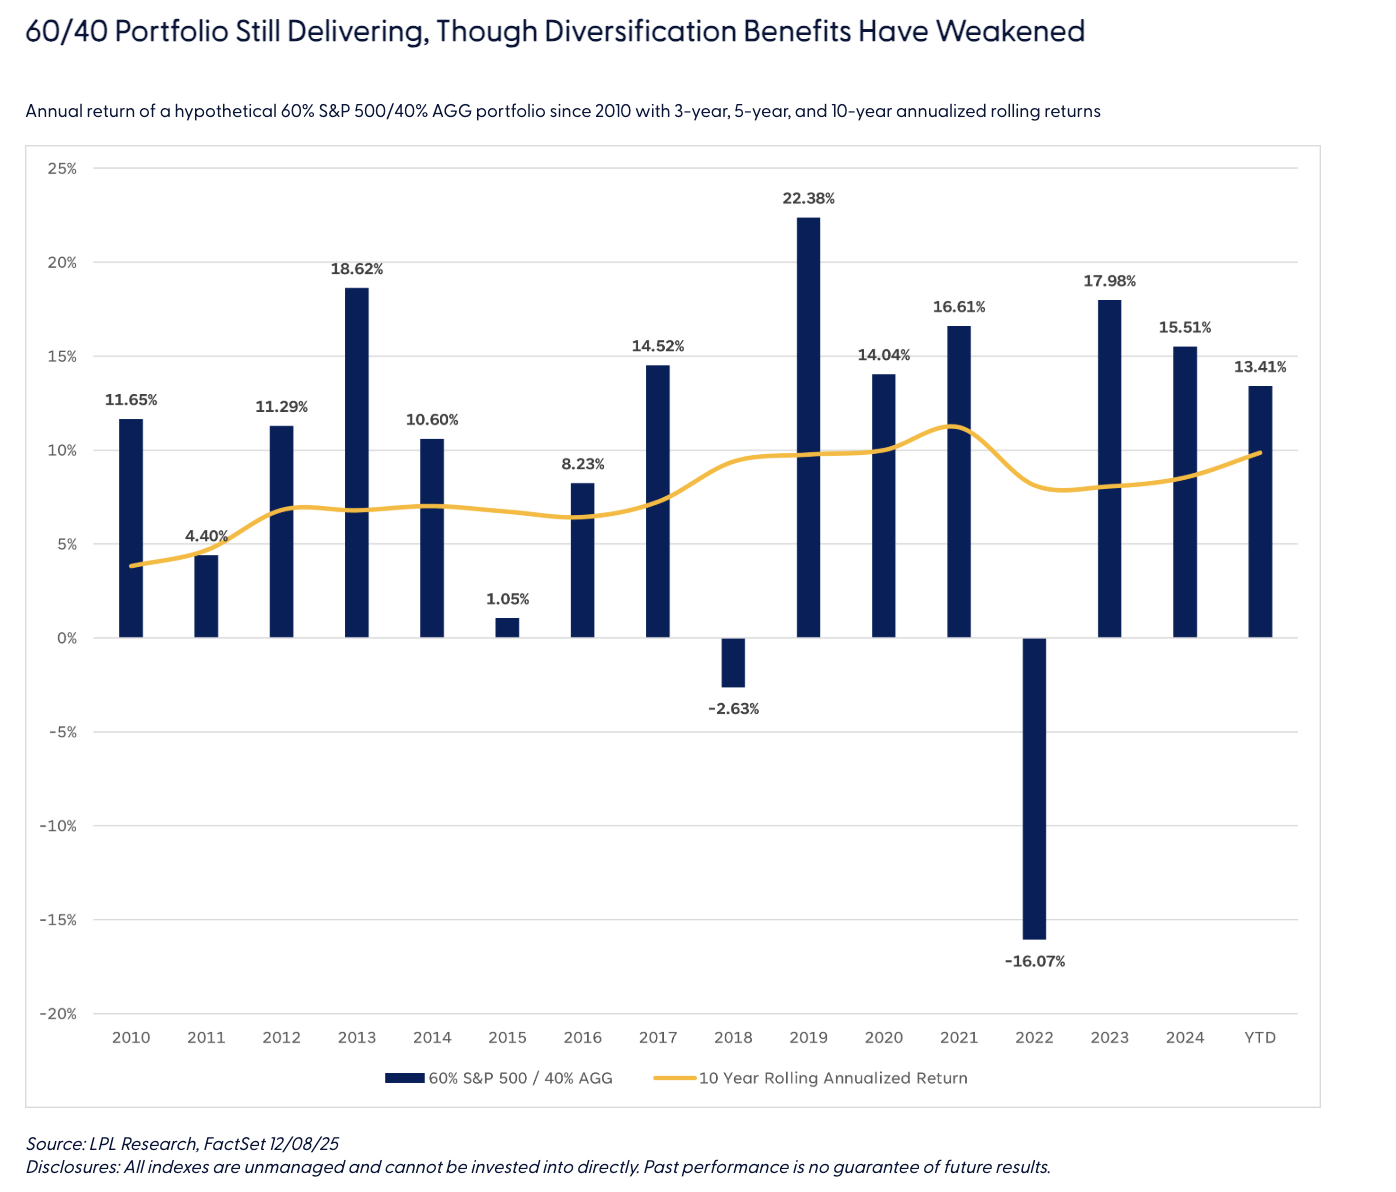
From 2010 onward, the diversification benefits of holding both asset classes began to erode, with stocks and bonds moving more in tandem with one another. While the 60/40 portfolio still performed well over this time frame (an annualized average return of roughly 10%), the streamlined returns investors once became accustomed to became less reliable.

The 60/40 portfolio produced positive returns in all but two calendar years (assuming this year finishes up), highlighting its resilience over a full market cycle. While utilizing a 60/40 portfolio has largely been fruitful over this period, you’ll notice that 2022 was a particularly tough year. In 2022, inflation spiked to a 40-year high, causing the Federal Reserve to raise rates to levels not seen since the 2008 financial crisis. This led to a steep sell-off in stocks and bonds, with the S&P 500 falling 18.1% and the Agg dropping 13%, with the latter experiencing its worst drawdown in history. While the 16% loss in 2022 was one of the worst years since inception, over longer rolling periods, such as the 10-year rolling period (yellow line), this strategy has rarely fallen below a 5% annualized return, with the average 10-year annualized rolling return being 7.8%.
Alternative Approaches
The 60/40 portfolio was popularized by U.S. institutions and advisors in the 1980s and 90s, when interest rates were steeply dropping from historic highs, inflation was relatively contained, and stock-bond correlation was low. The investing landscape has meaningfully changed since then as more asset classes have become available to investors. This has led many to modify the traditional 60/40, made up of only core domestic assets, to include asset categories across market capitalization (large, mid, and small), investment style (value, blend, and growth), international markets (developed and emerging), and diversifying strategies, such as real assets and alternative investments.
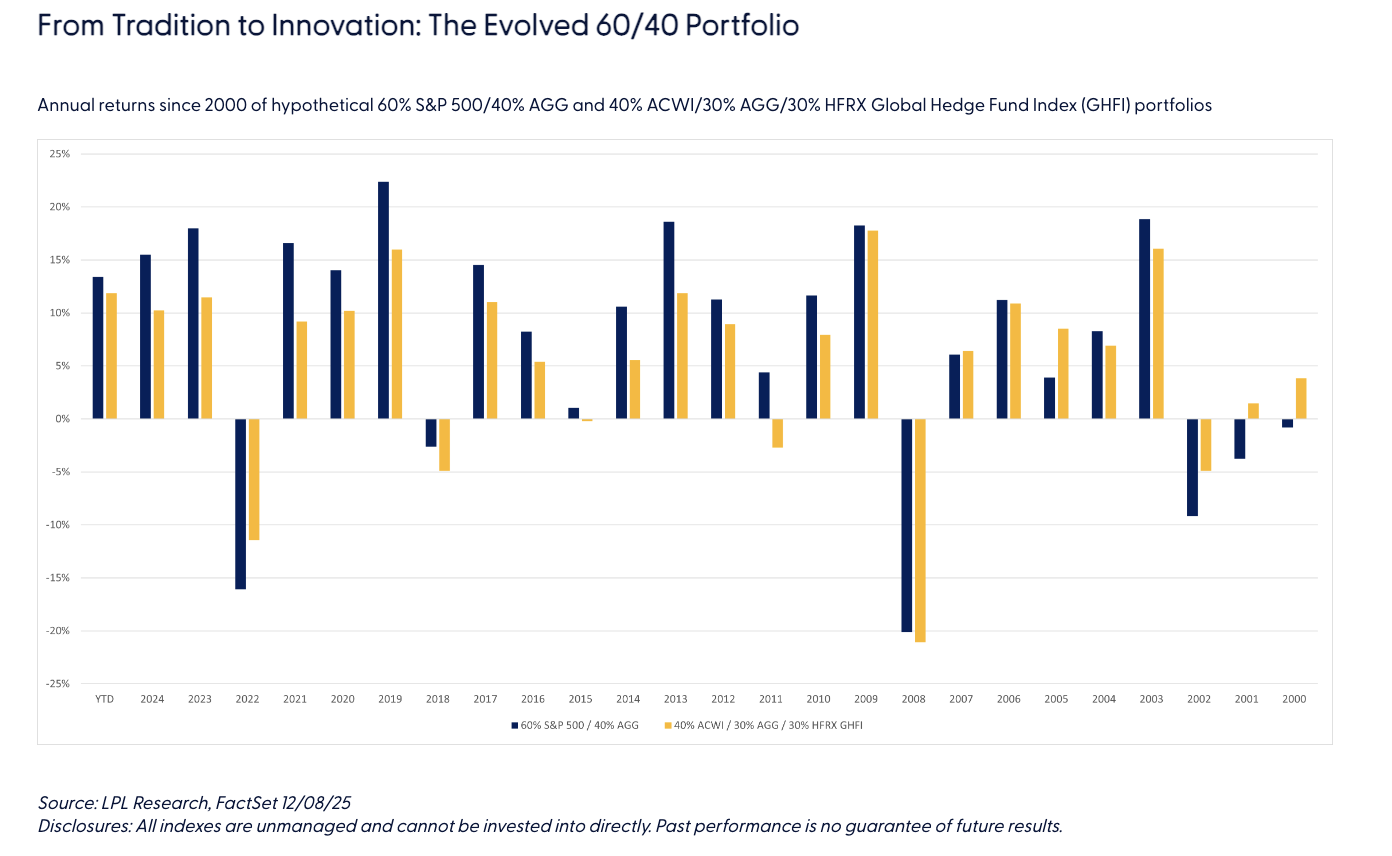
The inclusion of more asset classes in a 60/40 portfolio with less than perfectly correlated return streams may add diversification benefits with the ability to enhance returns and reduce risk. An alternative approach to the 60/40 portfolio that many asset allocators have taken is the 40/30/30, which is comprised of 40% equities, 30% fixed income, and 30% alternative investments, including private equity and credit, hedge funds, real estate, and commodities. In hindsight, the 40/30/30 would’ve yielded better results in 2022 when U.S. equities and fixed income each experienced negative double-digit returns and these alternative strategies had the ability to invest outside of traditional stocks and bonds. While some of the alternative investments are not available in a liquid investment vehicle, some real asset and hedge fund strategies are available to the average retail investor in a mutual fund or exchange-traded fund (ETF) structure.
Even without including any alternative assets, a relatively simple update to the traditional domestic 60/40 is the inclusion of international equities in the stock portion of the 60/40, adding diversification benefits due to lower correlations of global equity markets. It must be noted, however, that for much of the last decade and a half, international equities have been a drag on overall performance relative to domestic.
The traditional domestic 60/40 (blue bars) was often the best performer (13 out of 25 calendar years studied), however, it experienced more annualized volatility (10.9%) than the 40/30/30 (8.9%). It’s worth noting that the international 40/30/30 didn’t participate as much on the upside in any given year; however, the investor would have experienced a “smoother ride” through a number of market cycles with this more diversified allocation.
Conclusion
While the two components of the traditional 60/40 portfolio — stocks and bonds — have become more correlated in recent years, dampening their once-historical diversification benefit, this investment strategy still has merit today, especially once including international equities, as it emphasizes the need to spread investment risk and returns across less than perfectly correlated asset classes. As more diversifying asset classes come to market and proliferate, investors should consider the lesson Markowitz introduced nearly 70 years ago — that true portfolio resilience comes from broad diversification across multiple sources of return.
George Smith chairs the Tactical Model Portfolio Committee, which manages LPL Financial’s multi-asset models across multiple managed account platforms.
A message from Advisor Perspectives and VettaFi: Discover something new! Click here to register for our upcoming webcasts.
Important Disclosures
This material is for general information only and is not intended to provide specific advice or recommendations for any individual. There is no assurance that the views or strategies discussed are suitable for all investors. To determine which investment(s) may be appropriate for you, please consult your financial professional prior to investing.
Investing involves risks including possible loss of principal. No investment strategy or risk management technique can guarantee return or eliminate risk.
Indexes are unmanaged and cannot be invested into directly. Index performance is not indicative of the performance of any investment and does not reflect fees, expenses, or sales charges. All performance referenced is historical and is no guarantee of future results.
This material was prepared by LPL Financial, LLC. All information is believed to be from reliable sources; however LPL Financial makes no representation as to its completeness or accuracy.
Unless otherwise stated LPL Financial and the third party persons and firms mentioned are not affiliates of each other and make no representation with respect to each other. Any company names noted herein are for educational purposes only and not an indication of trading intent or a solicitation of their products or services.
Asset Class Disclosures –
International investing involves special risks such as currency fluctuation and political instability and may not be suitable for all investors. These risks are often heightened for investments in emerging markets.
Bonds are subject to market and interest rate risk if sold prior to maturity.
Municipal bonds are subject and market and interest rate risk and potentially capital gains tax if sold prior to maturity. Interest income may be subject to the alternative minimum tax. Municipal bonds are federally tax-free but other state and local taxes may apply.
Preferred stock dividends are paid at the discretion of the issuing company. Preferred stocks are subject to interest rate and credit risk. They may be subject to a call features.
Alternative investments may not be suitable for all investors and involve special risks such as leveraging the investment, potential adverse market forces, regulatory changes and potentially illiquidity. The strategies employed in the management of alternative investments may accelerate the velocity of potential losses.
Mortgage backed securities are subject to credit, default, prepayment, extension, market and interest rate risk.
High yield/junk bonds (grade BB or below) are below investment grade securities, and are subject to higher interest rate, credit, and liquidity risks than those graded BBB and above. They generally should be part of a diversified portfolio for sophisticated investors.
Precious metal investing involves greater fluctuation and potential for losses.
The fast price swings of commodities will result in significant volatility in an investor's holdings.
This research material has been prepared by LPL Financial LLC.
Not Insured by FDIC/NCUA or Any Other Government Agency | Not Bank/Credit Union Deposits or Obligations | Not Bank/Credit Union Guaranteed | May Lose Value
For Public Use – Tracking: #836257
Read more commentaries by LPL Financial