In the fast-paced world of investing, staying ahead of market shifts often means looking beyond the headlines. While familiar economic indicators like gross domestic product (GDP) growth, unemployment rates, and the Consumer Price Index (CPI) dominate financial news, they give investors only a limited view of the economy. Some savvy traders know that lesser-known economic indicators—those subtle undercurrents of data—offer additional insights and potential early warnings of booms or busts. These metrics, drawn from Federal Reserve research and industrial surveys, provide a nuanced view of financial health, production capacity, and systemic risks that more well-known indicators might overlook.
What is an economic indicator?
Economic indicators are data points or indexes that reflect the state of an economy at various levels, from broad national trends to sector-specific activities. They serve as barometers for growth, inflation, employment, and stability and help investors interpret how policies, consumer behavior, and global events might influence markets. Sourced from government agencies, central banks, or private surveys, these indicators range from raw statistics like factory output to composite scores blending multiple variables, such as the Institute for Supply Management's (ISM) Purchasing Managers' Index (PMI) that measures the health of the manufacturing and non-manufacturing sector. For traders, these are not just numbers—they're tools to forecast opportunities or risks, especially when combined with other data points like retail sales and new orders.
Types of economic indicators
These indicators fall into three main types:
-
Leading indicators, such as building permits or yield curve spreads, aim to predict future economic activity by offering a heads-up on expansions or contractions.
-
Lagging indicators, such as unemployment rates or corporate profits, confirm trends after they've occurred, useful for validating cycles.
-
Coincident indicators, including industrial production and personal income, track the economy in real time, offering a snapshot of current conditions.
Understanding these categories can help investors layer their analysis, blending foresight with confirmation to build resilient strategies amid uncertainty.
Viewing economic indicators on the thinkorswim Desktop platform
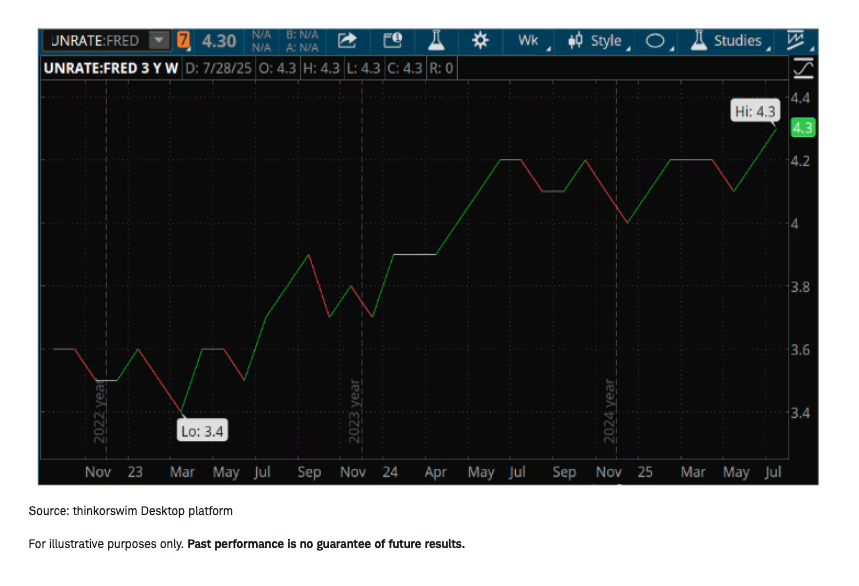
Platforms with a robust economic dataset, like thinkorswim® Desktop, make these indicators accessible to everyone. Instead of digging through obscure reports, traders can chart indicators alongside stocks, options, or futures to spot correlations and inform trades. If traders already know the indicator's symbol, the process is as simple as entering it in the symbol box on the Charts tab.
For example, to chart the unemployment rate, just type "UNRATE:FRED." This ease of access allows investors to monitor key metrics—such as the Consumer Sentiment Index and the University of Michigan's Index of Consumer Sentiment—to gauge consumer confidence and its potential impact on consumer spending.

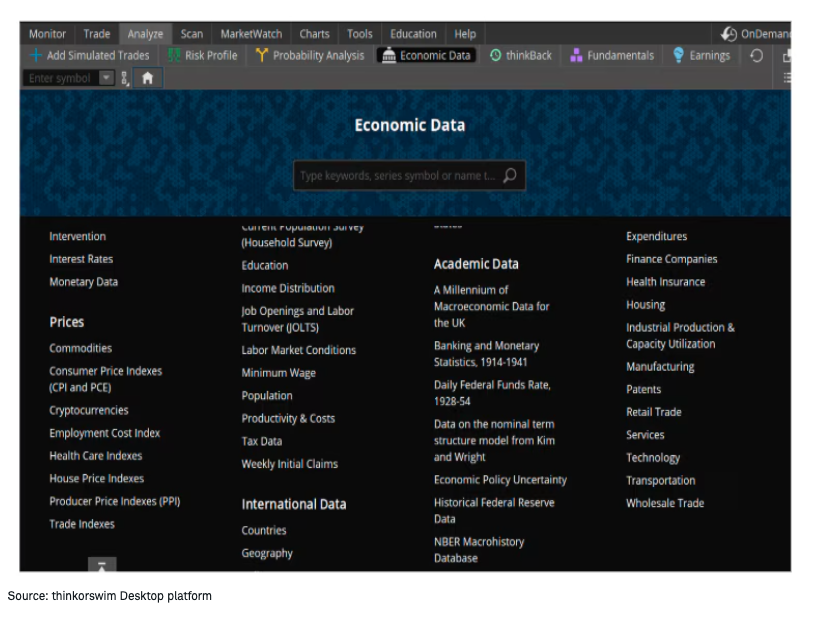
Note that economic indicators are typically best viewed using a line or area chart versus a candle chart. To see what indicators are available on thinkorswim Desktop, select the Economic Data subtab on the Analyze tab.
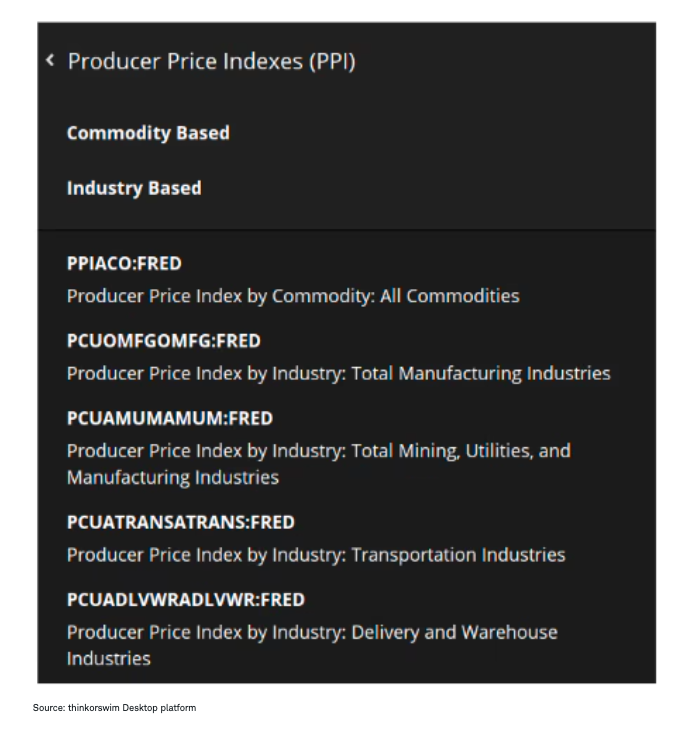
From this screen, a trader can focus on a particular category by selecting an area of interest. This will reveal all available indicators in that category as well as their associated ticker symbols. Select an indicator to generate a graph.
Lesser-known economic indicators
Let's review four under-the-radar indicators available on thinkorswim: the St. Louis Fed Financial Stress Index, the Chicago Fed National Activity Index, the Industrial Production: Capacity Utilization: Total Industry, and the Yield Curve Spread: 10-Year Treasury Minus 2-Year Treasury.
We'll break down what each indicator measures and why they might deserve a spot on a trader's watchlist.
St. Louis Fed Financial Stress Index
The St. Louis Fed Financial Stress Index (STLFSI4) is a weekly measure from the Federal Reserve Bank of St. Louis that combines seven market-based metrics like credit spreads and volatility to quantify U.S. financial system strain. Normalized around zero—where positive readings indicate heightened stress and negative ones suggest calm—it's updated frequently to provide timely insights. Traders can view the St. Louis Fed Financial Stress Index using symbol STLFSI4:FRED on thinkorswim.
The St. Louis Fed Financial Stress Index is considered a leading alert for market disruptions. For example, the reading spiked before the 2008 crash. Rising values signal credit tightness or liquidity issues that may prompt some investors to consider defensive moves in equities or bonds. Traders can pair this metric with other indicators—such as the Chicago Fed National Financial Conditions Index (NFCI)—to gauge the overall health of the financial system.
Chicago Fed National Activity Index
The Chicago Fed National Activity Index (CFNAI) aggregates 85 monthly indicators from production, employment, and consumption into a single score, benchmarking U.S. growth against historical trends. Above zero signals expansion; below hints at a slowdown, with readings under –0.70 potentially foreshadowing a recession. Investors can view the Chicago Fed National Activity Index using symbol CFNAI:FRED on thinkorswim.
This coincident-to-leading tool empowers investors by helping spot cycle turns early, often ahead of GDP data. A positive shift can be viewed as bullish for cyclical stocks, while declines typically favor safe-haven names. By monitoring this index alongside other indicators, such as the Conference Board's Leading Economic Index (LEI), investors can gain a more comprehensive view of the economy's growth rate and potential risks.
Industrial Production: Capacity Utilization: Total Industry
Industrial Production: Capacity Utilization: Total Industry (TCU) tracks the percentage of U.S. manufacturing, mining, and utility capacity in use, based on monthly output data. Typically (around 78% – 80% in stable times), it reveals operational intensity relative to sustainable peaks. Investors can view Industrial Production: Capacity Utilization: Total Industry using symbol TCU:FRED on thinkorswim.
TCU is crucial for spotting inflation risks or economic slack—high levels above 80% warn of bottlenecks and price pressures that can often boost commodities, while low levels signal potential downturns. On thinkorswim, traders might consider charting it against industrial ETFs to help time sector rotations. This combination may offer supply-side clarity that complements consumer-focused metrics for balanced investing.
Yield Curve Spread: 10-Year Treasury Minus 2-Year Treasury
The Yield Curve Spread: 10-Year Treasury Minus 2-Year Treasury (T10Y2Y) measures the daily difference between 10-year and 2-year U.S. Treasury yields. A positive spread indicates a normal yield curve; a negative (inverted) spread has pre-dated every U.S. recession since 1955, although not every inversion had led to a recession. Investors can view the Yield Curve Spread: 10-Year Treasury Minus 2-Year Treasury using symbol T10Y2Y:FRED on thinkorswim.
Investors applaud the Yield Curve Spread for its forecasting power that can potentially signal economic slowdowns six to 24 months ahead. Inversions typically cue defensive shifts to bonds or utilities, while steepening action supports risk assets. On the thinkorswim platform, traders might view it in combination with other indicators—such as the 10-Year Treasury Constant Maturity Minus 2-Year Treasury Constant Maturity (T10Y2Y)—to help anticipate market pivots.
Beyond the basics: Empowering investors on the thinkorswim platform
These four indicators—St. Louis Fed Financial Stress Index, Chicago Fed National Activity Index, Industrial Production: Capacity Utilization: Total Industry, and Yield Curve Spread: 10-Year Treasury Minus 2-Year Treasury—might not be as well-known as inflation data and unemployment rates, but their expansive view of the economy makes them indispensable for discerning investors.
Of course, no indicator is infallible; they shine brightest when combined with broader analysis. But in a market where information asymmetry separates winners from watchers, delving into these lesser-known signals is a low-effort way to elevate an investor's game. As economic cycles evolve—think AI-driven productivity or persistent inflation scars—tools like these keep an investor adaptive. Dive into the thinkorswim platform and view these indicators—even add them to a watchlist—and observe how these hidden gems can illuminate paths to smarter investing.
A message from Advisor Perspectives and VettaFi: Discover something new! Click here to register for our upcoming webcasts.
All product symbols, names, market data and images used are for illustrative purposes only, and should not be considered an offer to sell or a solicitation of an offer to purchase any product or employ any strategy.
All expressions of opinion are subject to change without notice in reaction to shifting market, economic or political conditions. Data contained herein from third party providers is obtained from what are considered reliable sources. However, its accuracy, completeness or reliability cannot be guaranteed.
This material is intended for general informational and educational purposes only. This should not be considered an individualized recommendation or personalized investment advice. The investment strategies mentioned may not be suitable for everyone. Each investor needs to review an investment strategy for his or her own particular situation before making any investment decisions.
For illustrative purpose(s) only. Individual situations will vary. Not intended to be reflective of results you can expect to achieve.
Schwab does not recommend the use of technical analysis as a sole means of investment research.
Investing involves risk, including loss of principal.
Supporting documentation for any claims or statistical information is available upon request.
Investment and Insurance Products Are: Not FDIC Insured • Not Insured by Any Federal Government Agency • Not a Deposit or Other Obligation of, or Guaranteed by, the Bank or any of its Affiliates • Subject to Investment Risks, Including Possible Loss of Principal Amount Invested
The Charles Schwab Corporation provides a full range of brokerage, banking and financial advisory services through its operating subsidiaries. Its broker-dealer subsidiary, Charles Schwab & Co. Inc. (Member SIPC), and its affiliates offer investment services and products. Its banking subsidiary, Charles Schwab Bank, SSB (member FDIC and an Equal Housing Lender), provides deposit and lending services and products.
This site is designed for U.S. residents. Non-U.S. residents are subject to country-specific restrictions. Learn more about our services for non-U.S. residents, Charles Schwab Hong Kong clients, Charles Schwab U.K. clients.
© 2025 Charles Schwab & Co., Inc. All rights reserved. Member SIPC. Unauthorized access is prohibited. Usage will be monitored.
© Charles Schwab
Read more commentaries by Charles Schwab