Will the Santa Claus Rally Spark a Bullish Start to 2026?
Membership required
Membership is now required to use this feature. To learn more:
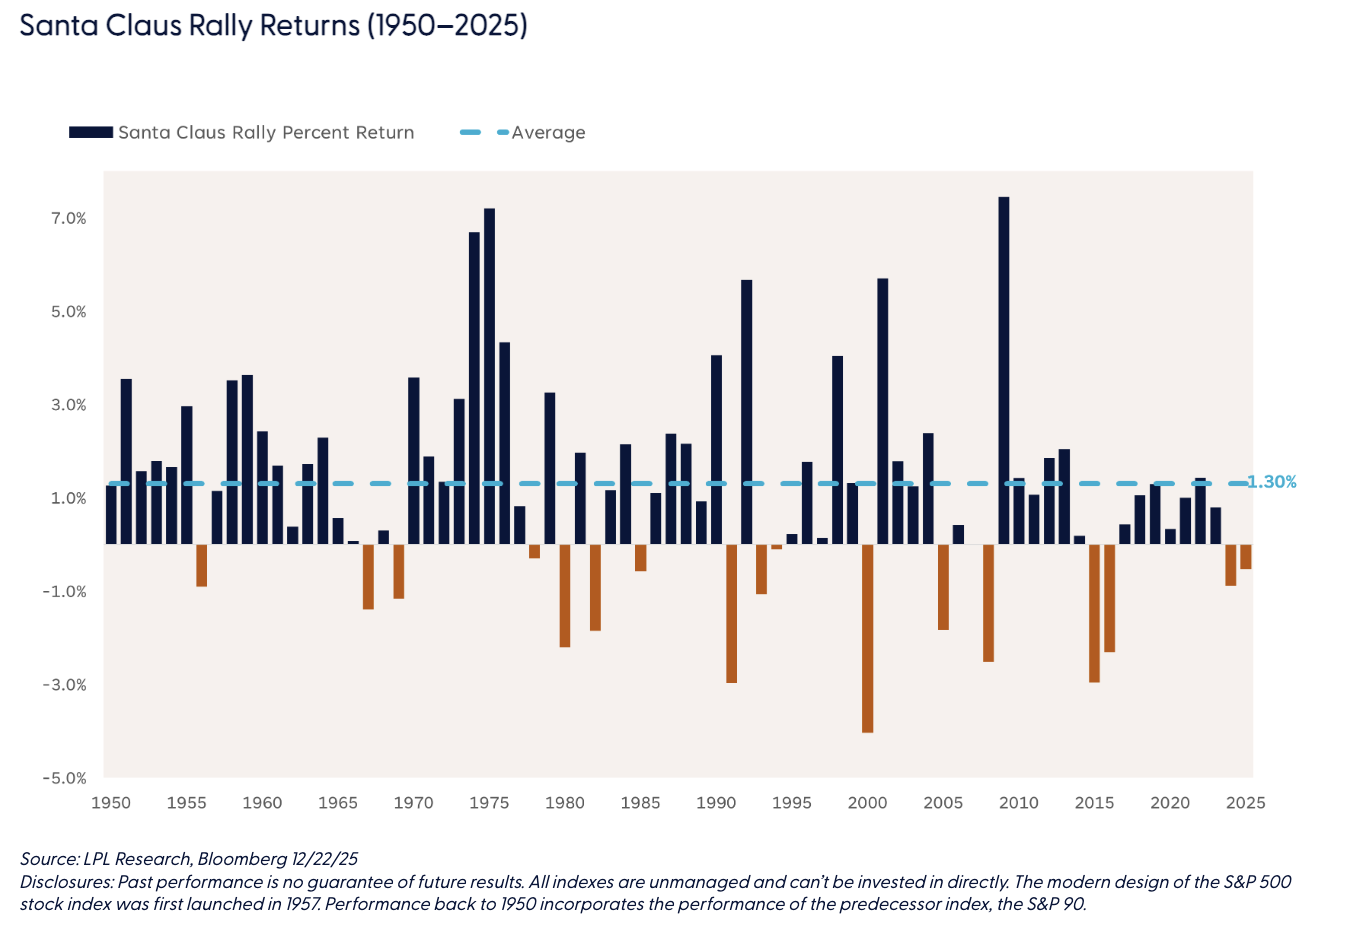
View Membership BenefitsThe much-anticipated Santa Claus Rally period officially begins tomorrow. This historically strong seven-day stretch for stocks was first identified by Yale Hirsch in 1972. Hirsch, the creator of the Stock Trader’s Almanac, defined the period as the last five trading days of the year plus the first two trading days of the new year.
The Santa Claus Rally often grabs headlines because markets tend to deliver solid gains during this short window — or perhaps because it falls during a typically quiet news cycle. Either way, history shows a clear pattern: since 1950, the S&P 500 has averaged a 1.3% return during this period, with positive results occurring 78% of the time. For comparison, the market’s typical seven-day average return is just 0.3%, with a positivity rate of 58%.
That said, seasonal trends reflect historical tendencies, not guarantees. They don’t account for fundamentals like earnings, monetary and fiscal policy changes, or economic conditions. The last two years of negative Santa Claus Rally returns are a reminder that past performance is never a promise of future results.
The Naughty or Nice List
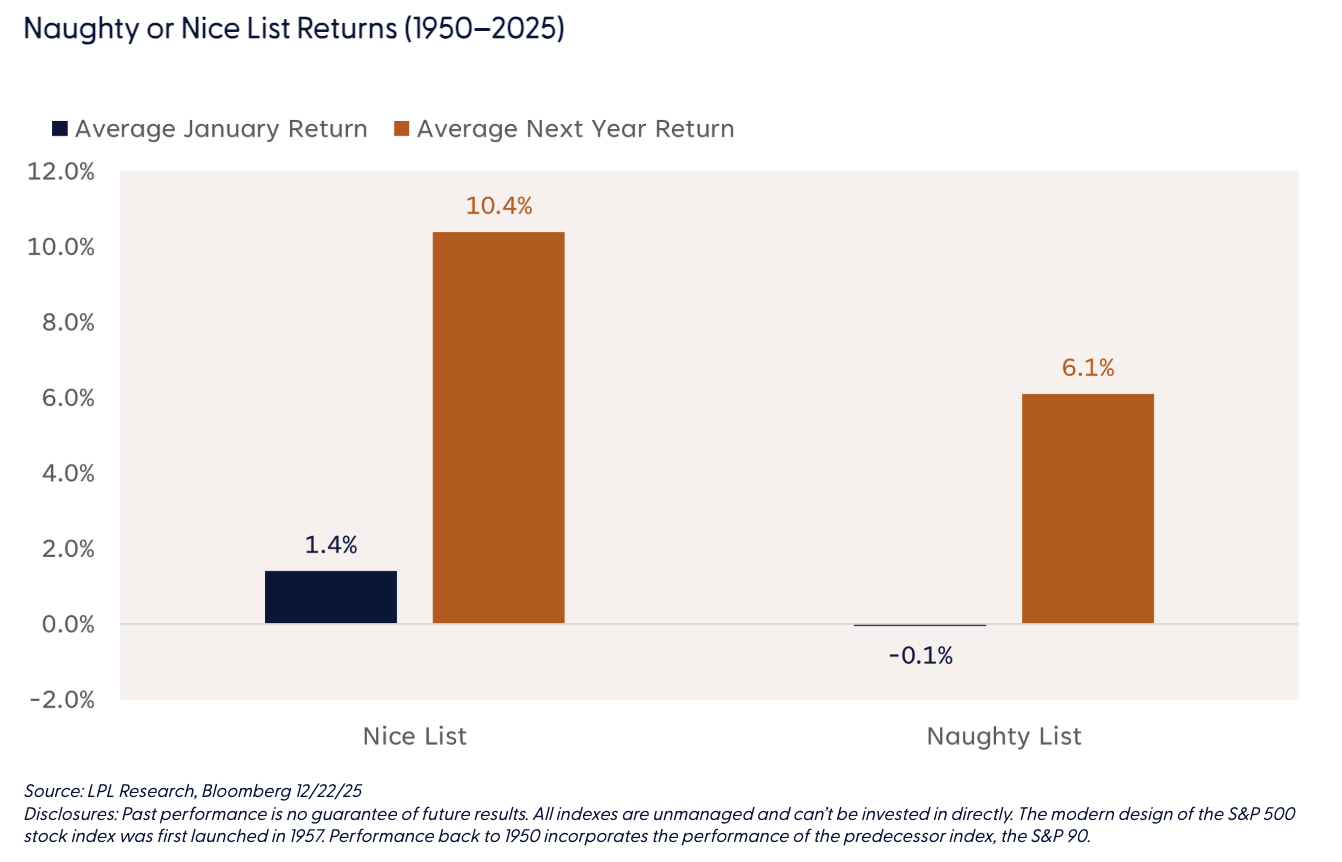
Another intriguing aspect of the Santa Claus Rally is its historical connection to January performance and the following year’s returns. Yale Hirsch captured this idea with his well-known phrase: “If Santa Claus should fail to call, bears may come to Broad and Wall.”
Historical data backs up this adage. When the rally is positive — putting investors on the “nice” list — the S&P 500 has delivered an average January gain of 1.4% and an impressive 10.4% return for the full year that follows. In contrast, when the index was down during this period — the “naughty” list — the averages dropped to only -0.1% for January and 6.1% for the subsequent year.
Technical Perspective
The technical backdrop remains supportive of a year-end rally, raising the possibility that the S&P 500 could avoid an unprecedented third consecutive year of negative Santa Claus Rally returns. Recent strength has lifted the index back above its 20- and 50-day moving averages (dmas), with the December highs at 6,901 now serving as the next major resistance level to clear. A sustained breakout above this threshold would complete the ongoing multi-month consolidation phase and generate a minimum technical-based price objective of around 7,270.
Market participation has also improved as stocks recovered from November’s pullback. Leadership has shifted toward more economically sensitive sectors, signaling a renewed appetite for risk. Financials, industrials, and materials have shown notable internal strength, with a growing share of constituents hitting new four-week highs. This marks a sharp reversal from November, when investors favored defensive areas like healthcare and energy.
Conclusion
Momentum heading into year-end suggests a favorable setup for a positive Santa Claus Rally — a historically bullish signal for January and the year ahead. While overall market breadth remains somewhat narrow for an index near record highs, the trend is moving in the right direction, supported by a rotation toward cyclical sectors. A close above the S&P 500’s December high could pave the way for the next leg higher above the 7,000-point milestone.
However, risks remain. Increased scrutiny over artificial intelligence — given lofty expectations for earnings and spending — could weigh on sentiment. Inflation concerns may also resurface, reducing prospects for rate cuts, while continued labor market weakness could add to economic uncertainty. Additionally, 10-year Treasury yields are hovering just below key resistance at 4.20%. A breakout above this threshold could push yields toward 4.50%, potentially dampening the recent rebound in equity markets.
Adam Turnquist oversees the management and development of technical research at LPL Financial. His investment career spans over 15 years.
Important Disclosures
This material is for general information only and is not intended to provide specific advice or recommendations for any individual. There is no assurance that the views or strategies discussed are suitable for all investors. To determine which investment(s) may be appropriate for you, please consult your financial professional prior to investing.
Investing involves risks including possible loss of principal. No investment strategy or risk management technique can guarantee return or eliminate risk.
Indexes are unmanaged and cannot be invested into directly. Index performance is not indicative of the performance of any investment and does not reflect fees, expenses, or sales charges. All performance referenced is historical and is no guarantee of future results.
This material was prepared by LPL Financial, LLC. All information is believed to be from reliable sources; however LPL Financial makes no representation as to its completeness or accuracy.
Unless otherwise stated LPL Financial and the third party persons and firms mentioned are not affiliates of each other and make no representation with respect to each other. Any company names noted herein are for educational purposes only and not an indication of trading intent or a solicitation of their products or services.
Asset Class Disclosures –
International investing involves special risks such as currency fluctuation and political instability and may not be suitable for all investors. These risks are often heightened for investments in emerging markets.
Bonds are subject to market and interest rate risk if sold prior to maturity.
Municipal bonds are subject and market and interest rate risk and potentially capital gains tax if sold prior to maturity. Interest income may be subject to the alternative minimum tax. Municipal bonds are federally tax-free but other state and local taxes may apply.
Preferred stock dividends are paid at the discretion of the issuing company. Preferred stocks are subject to interest rate and credit risk. They may be subject to a call features.
Alternative investments may not be suitable for all investors and involve special risks such as leveraging the investment, potential adverse market forces, regulatory changes and potentially illiquidity. The strategies employed in the management of alternative investments may accelerate the velocity of potential losses.
Mortgage backed securities are subject to credit, default, prepayment, extension, market and interest rate risk.
High yield/junk bonds (grade BB or below) are below investment grade securities, and are subject to higher interest rate, credit, and liquidity risks than those graded BBB and above. They generally should be part of a diversified portfolio for sophisticated investors.
Precious metal investing involves greater fluctuation and potential for losses.
The fast price swings of commodities will result in significant volatility in an investor's holdings.
This research material has been prepared by LPL Financial LLC.
Not Insured by FDIC/NCUA or Any Other Government Agency | Not Bank/Credit Union Deposits or Obligations | Not Bank/Credit Union Guaranteed | May Lose Value
For Public Use – Tracking: #840603
A message from Advisor Perspectives and VettaFi: Discover something new! Click here to register for our upcoming webcasts.
Membership required
Membership is now required to use this feature. To learn more:
View Membership BenefitsSponsored Content
Upcoming Virtual Events View All


