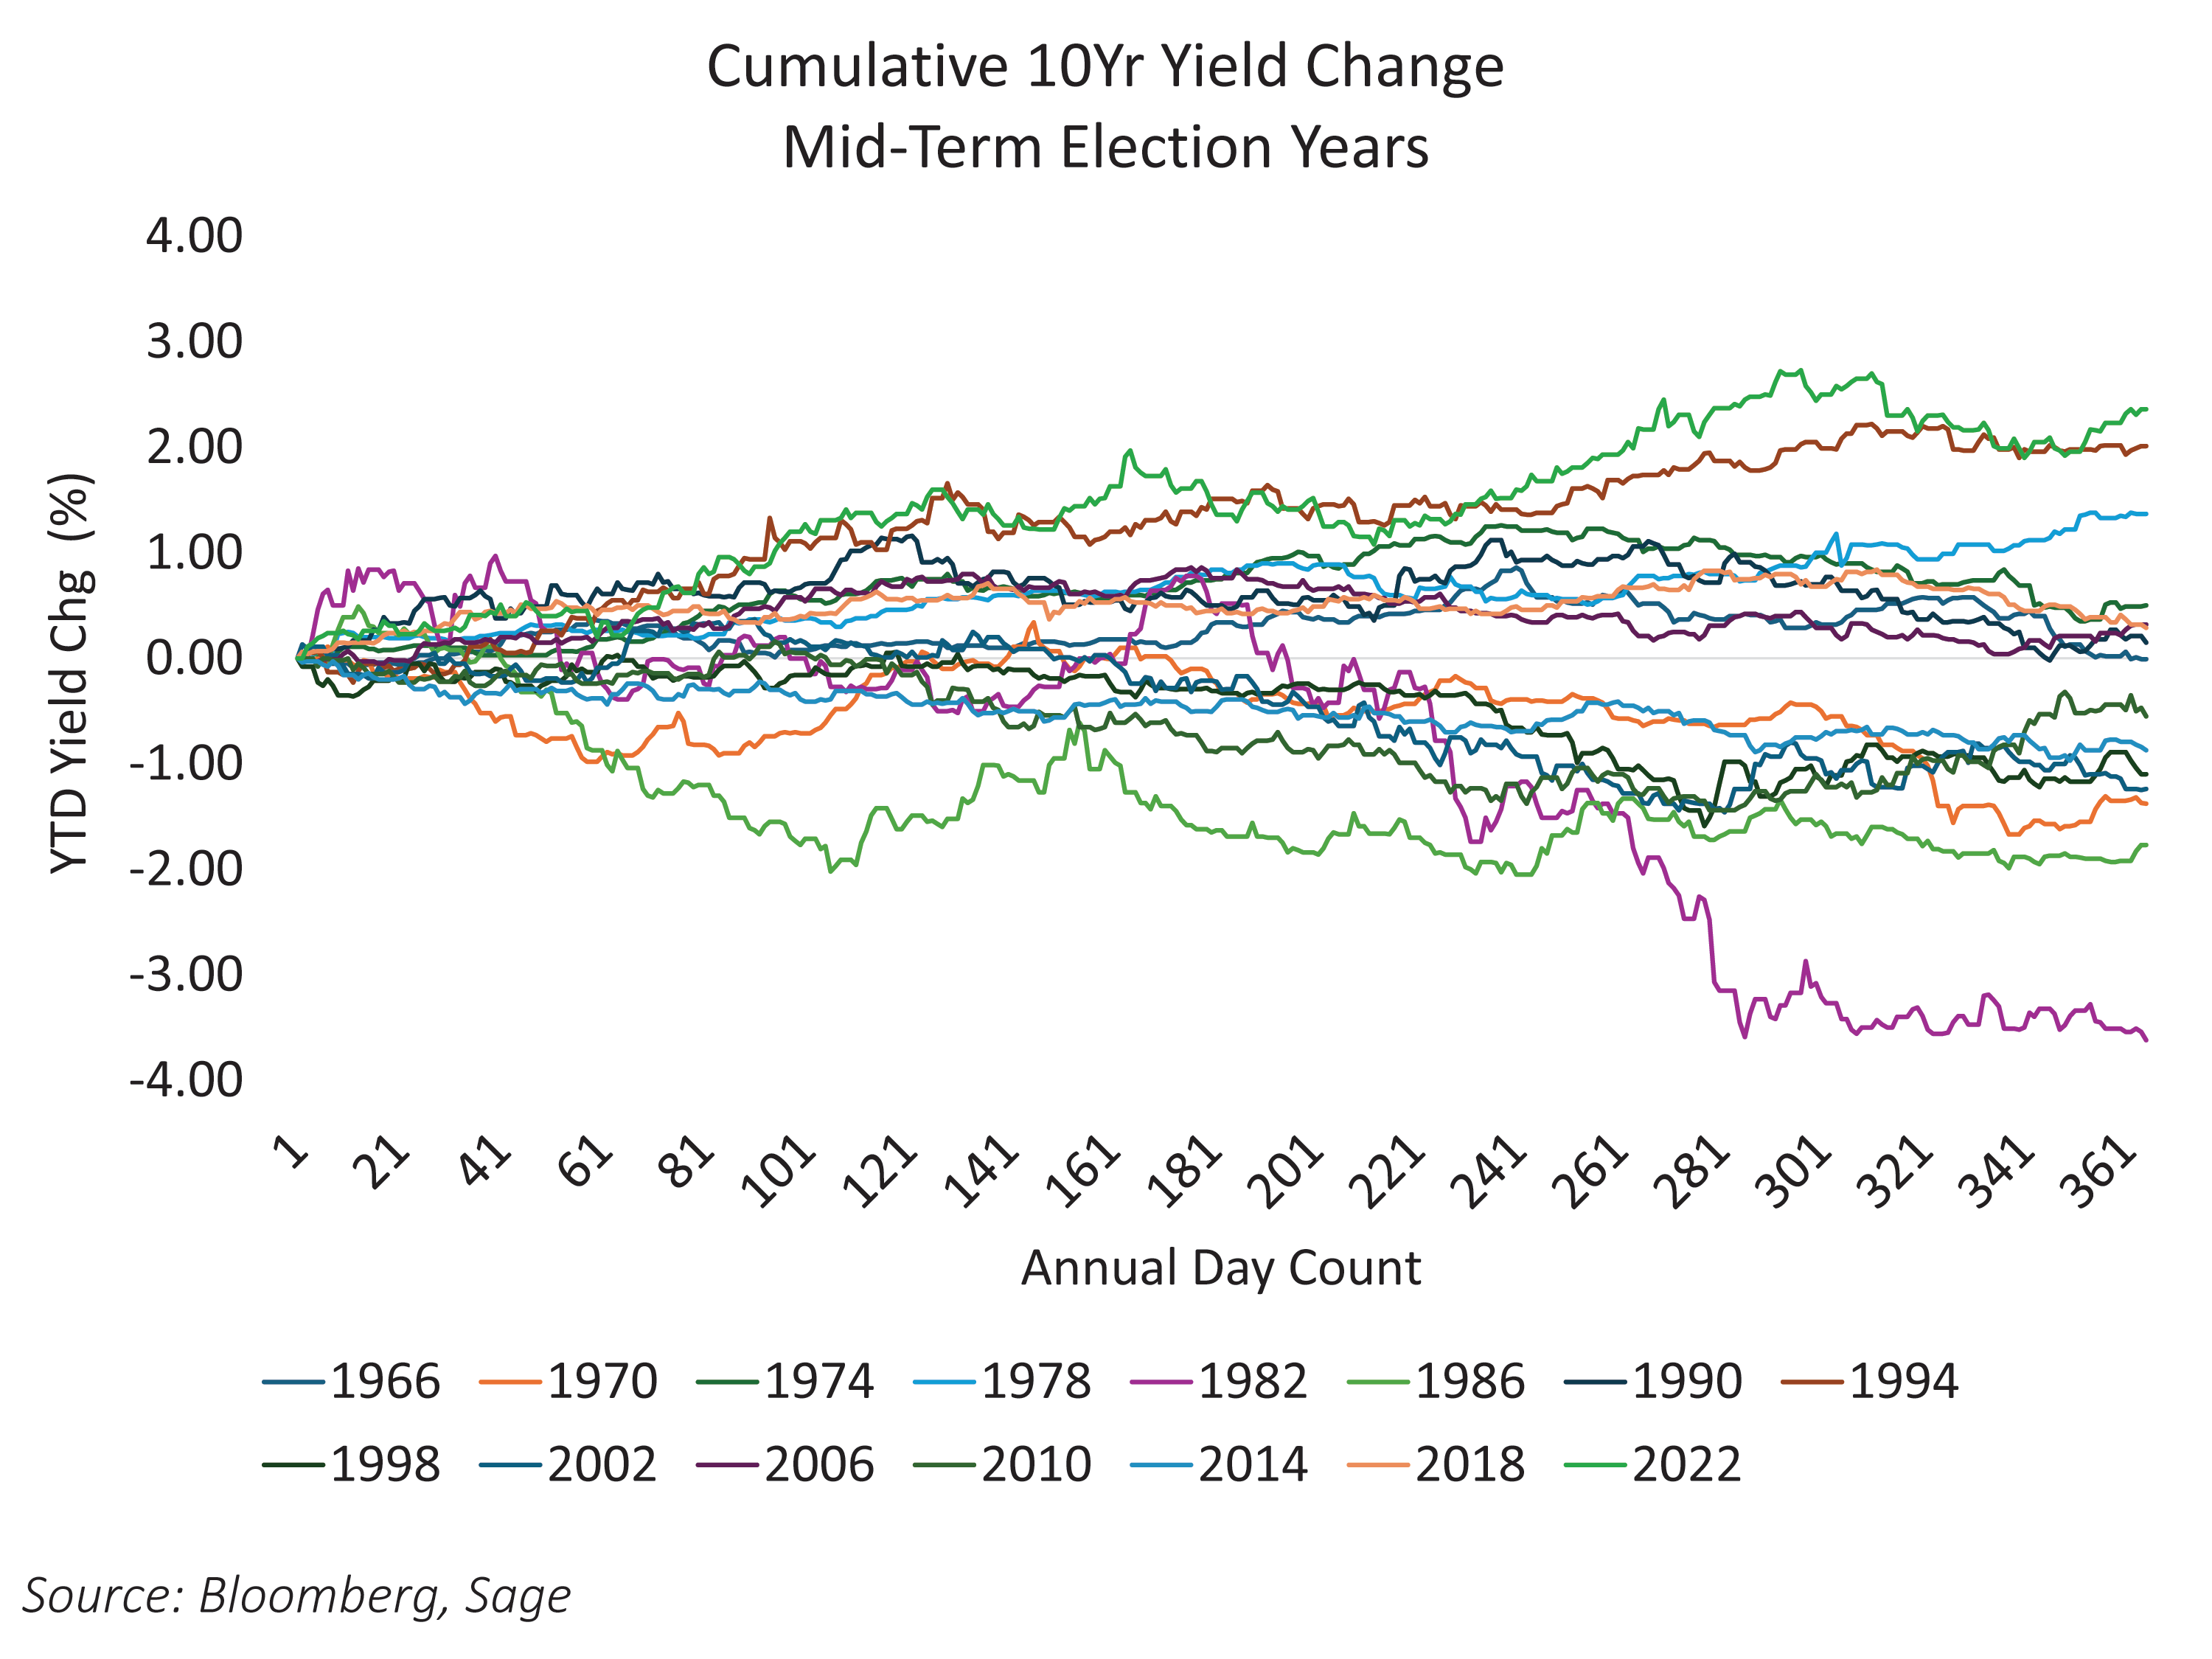
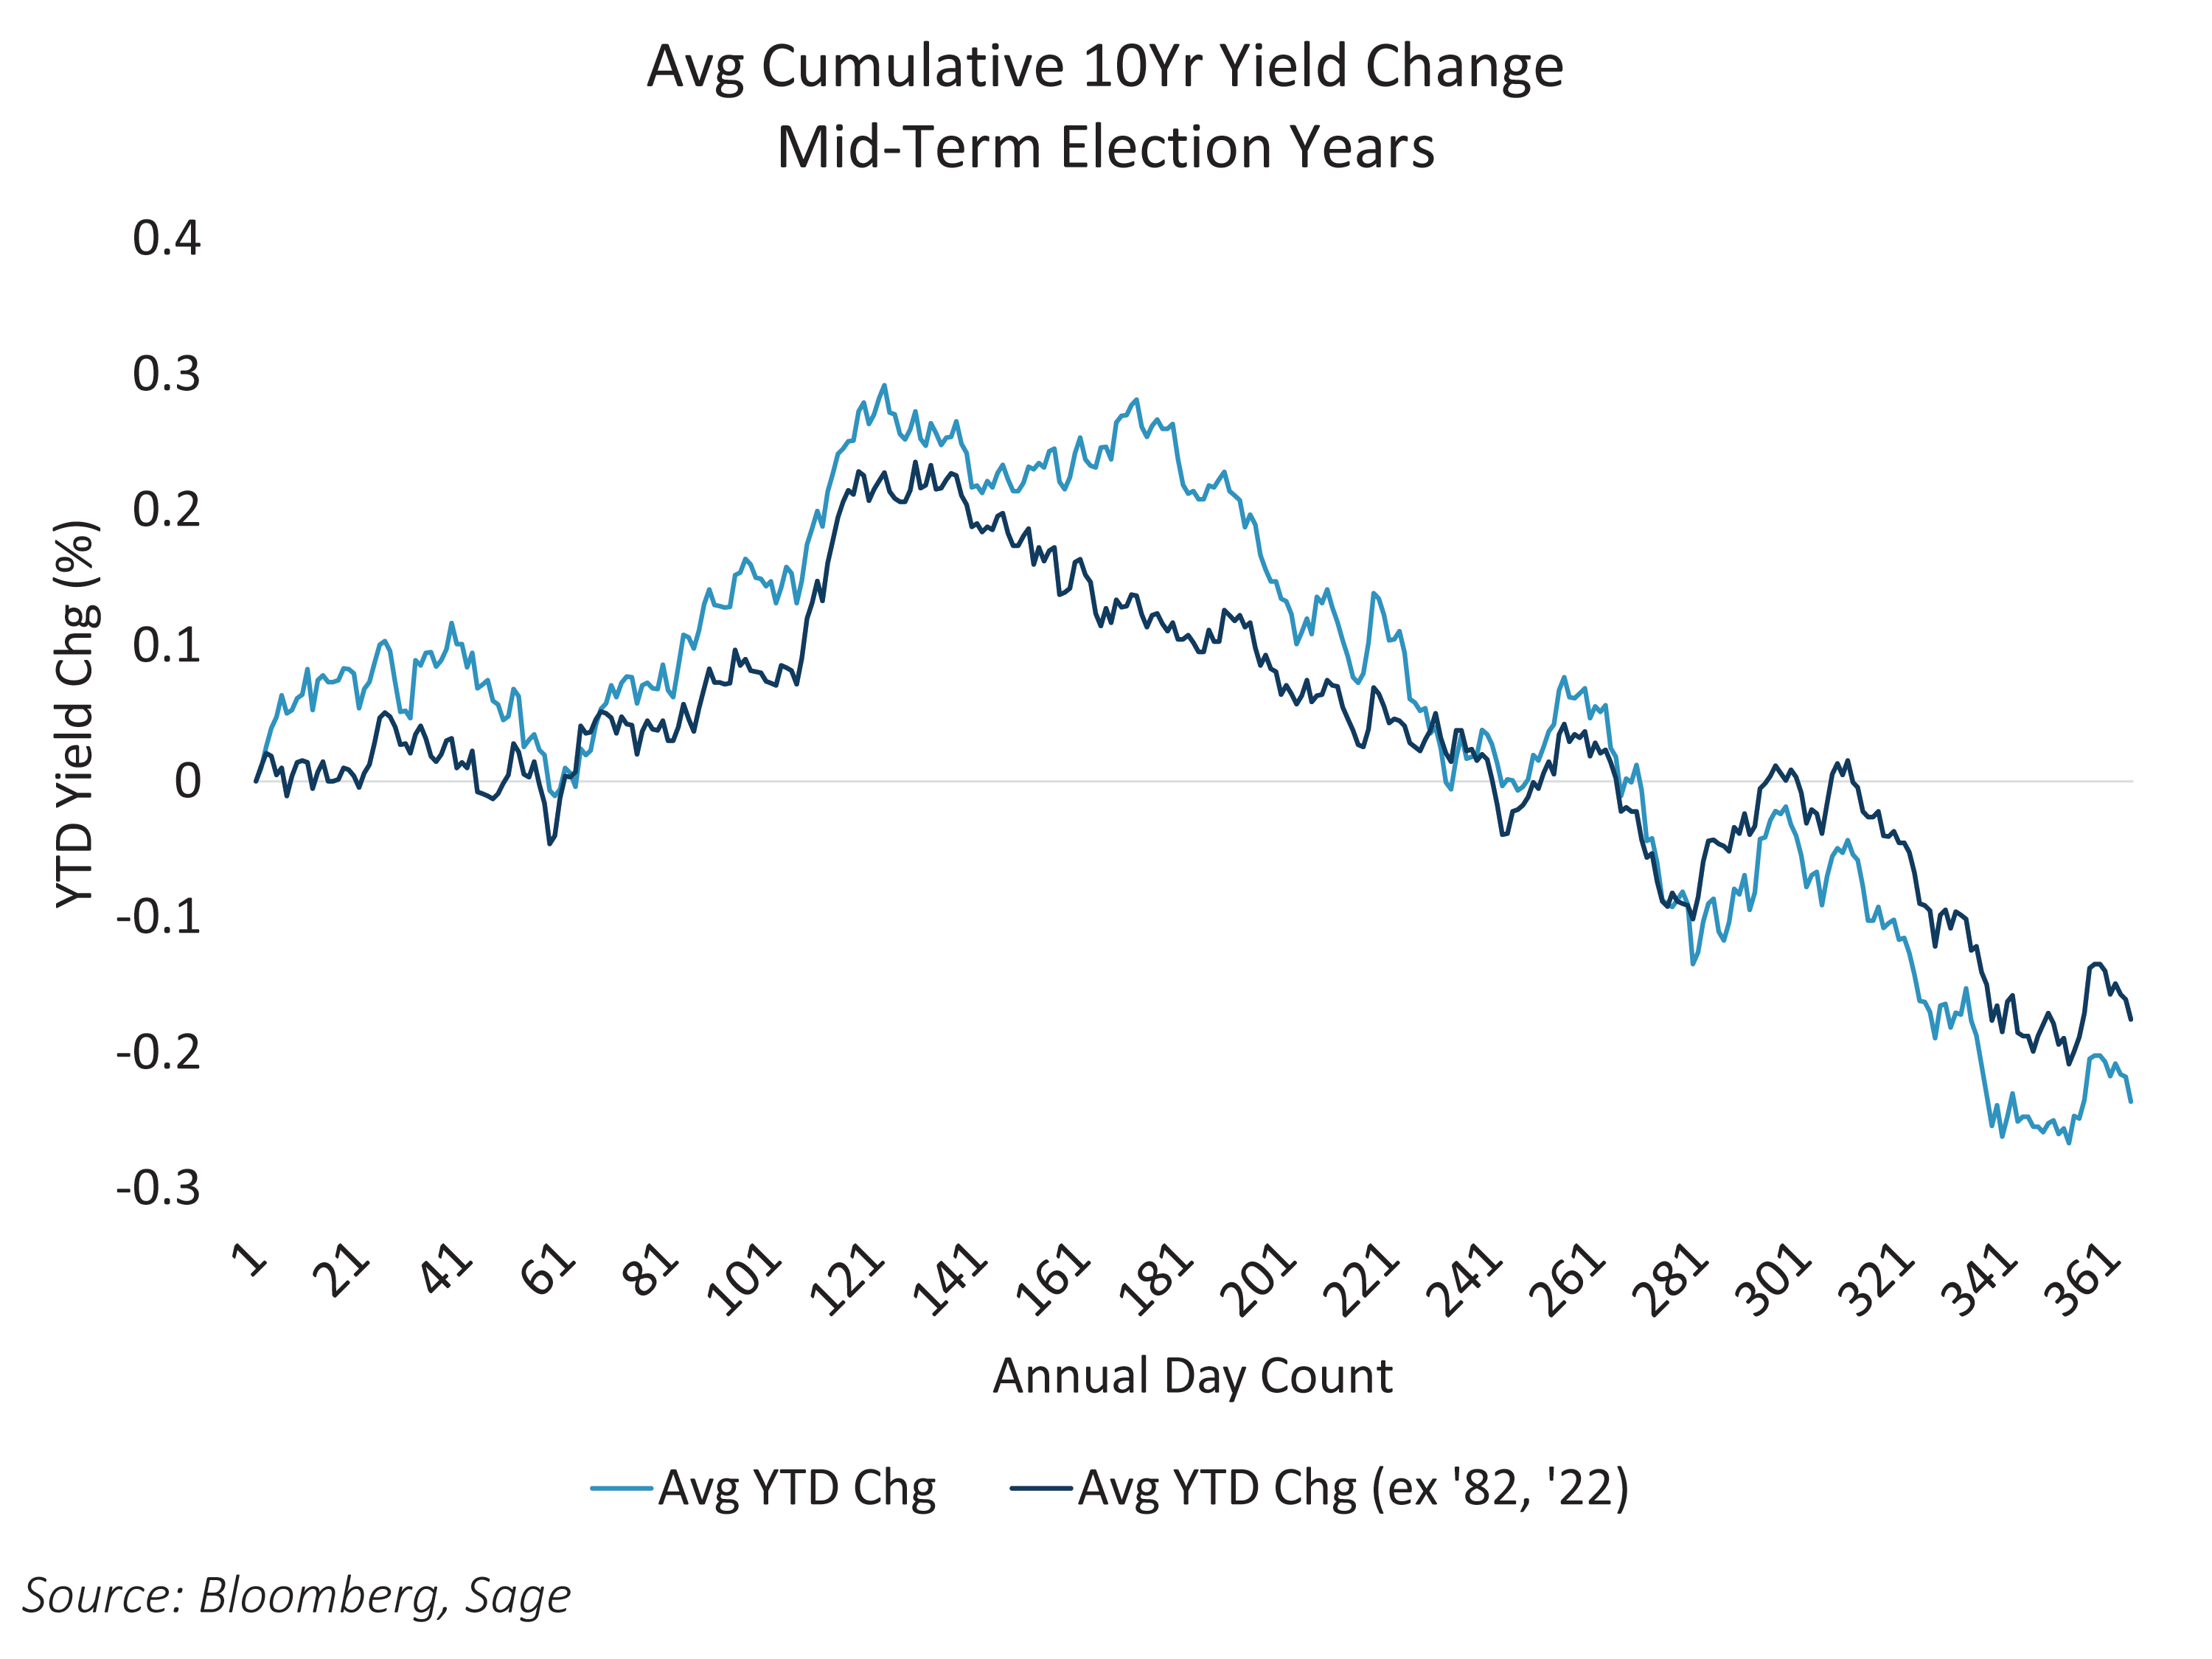
Midterm election years have a rhythm that fixed income investors should recognize. While at first glance yields may seem unpredictable, a closer look reveals a pattern in how they behave throughout these periods. Historical data shows a clear tendency for 10-year Treasury yields to rise during the first half of the year and decline in the second half. This trend has persisted across multiple decades and various economic environments. Even after removing years with extreme policy shifts, such as 1982 and 2022, the pattern remains intact, reinforcing its reliability as a cyclical feature rather than a statistical anomaly.

The Data Behind the Trend
Year to date, the trend is clear. By midyear, 10-year Treasury yields have typically climbed about 20 to 30 basis points from where they started in January. Then the second half reverses that move. Yields tend to fall on average by 40 basis points throughout the remainder of the year, and by December the average year-to-date change is roughly 20 basis points below the level at the start of the year. This pattern has held through inflationary periods, low-rate environments, and different fiscal backdrops. Even after excluding years dominated by aggressive Federal Reserve actions, it suggests that election-driven dynamics exert a meaningful influence on the yield curve.
Drivers of the Pattern and the Role of Policy
During election season, campaigns often promote policy initiatives aimed at driving economic growth. That narrative tends to shape investor expectations, creating a belief that stronger growth will follow. Historically, this belief correlates with higher interest rates as markets price in future economic expansion. In the second half of the year, the tone shifts. Midterm elections frequently result in the majority party losing control of Congress, which introduces legislative gridlock. Gridlock effectively removes the prospect of major growth-oriented policies, reduces fiscal stimulus concerns, and limits the ability to implement significant initiatives. The result is a backdrop that favors lower yields as uncertainty fades and expectations for aggressive policy action diminish.
Implications for 2026
If historical patterns hold, 2026 could present an opportunity for bond investors. A first-half rise followed by a second-half decline suggests that extending duration later in the year may be advantageous. While no cycle is guaranteed to be repeated perfectly, the persistence of this trend, even after adjusting for years of extreme policy intervention, strengthens the case for strategic positioning. For fixed income portfolios, midterm years often reward patience and timing.
Originally published January 5, 2025
Originally published on ETF Trends
For more news, information, and strategy, visit the ETF Strategist Content Hub.
Disclosures:
This is for informational purposes only and is not intended as investment advice or an offer or solicitation with respect to the purchase or sale of any security, strategy or investment product. Although the statements of fact, information, charts, analysis and data in this report have been obtained from, and are based upon, sources Sage believes to be reliable, we do not guarantee their accuracy, and the underlying information, data, figures and publicly available information has not been verified or audited for accuracy or completeness by Sage. Additionally, we do not represent that the information, data, analysis and charts are accurate or complete, and as such should not be relied upon as such. All results included in this report constitute Sage’s opinions as of the date of this report and are subject to change without notice due to various factors, such as market conditions. Investors should make their own decisions on investment strategies based on their specific investment objectives and financial circumstances. All investments contain risk and may lose value. Past performance is not a guarantee of future results.
Sage Advisory Services, Ltd. Co. is a registered investment adviser that provides investment management services for a variety of institutions and high net worth individuals. For additional information on Sage and its investment management services, please view our website at www.sageadvisory.com, or refer to our Form ADV, which is available upon request by calling 512.327.5530.
A message from Advisor Perspectives and VettaFi: Discover something new! Click here to register for our upcoming webcasts.
Read more commentaries by Sage Advisory