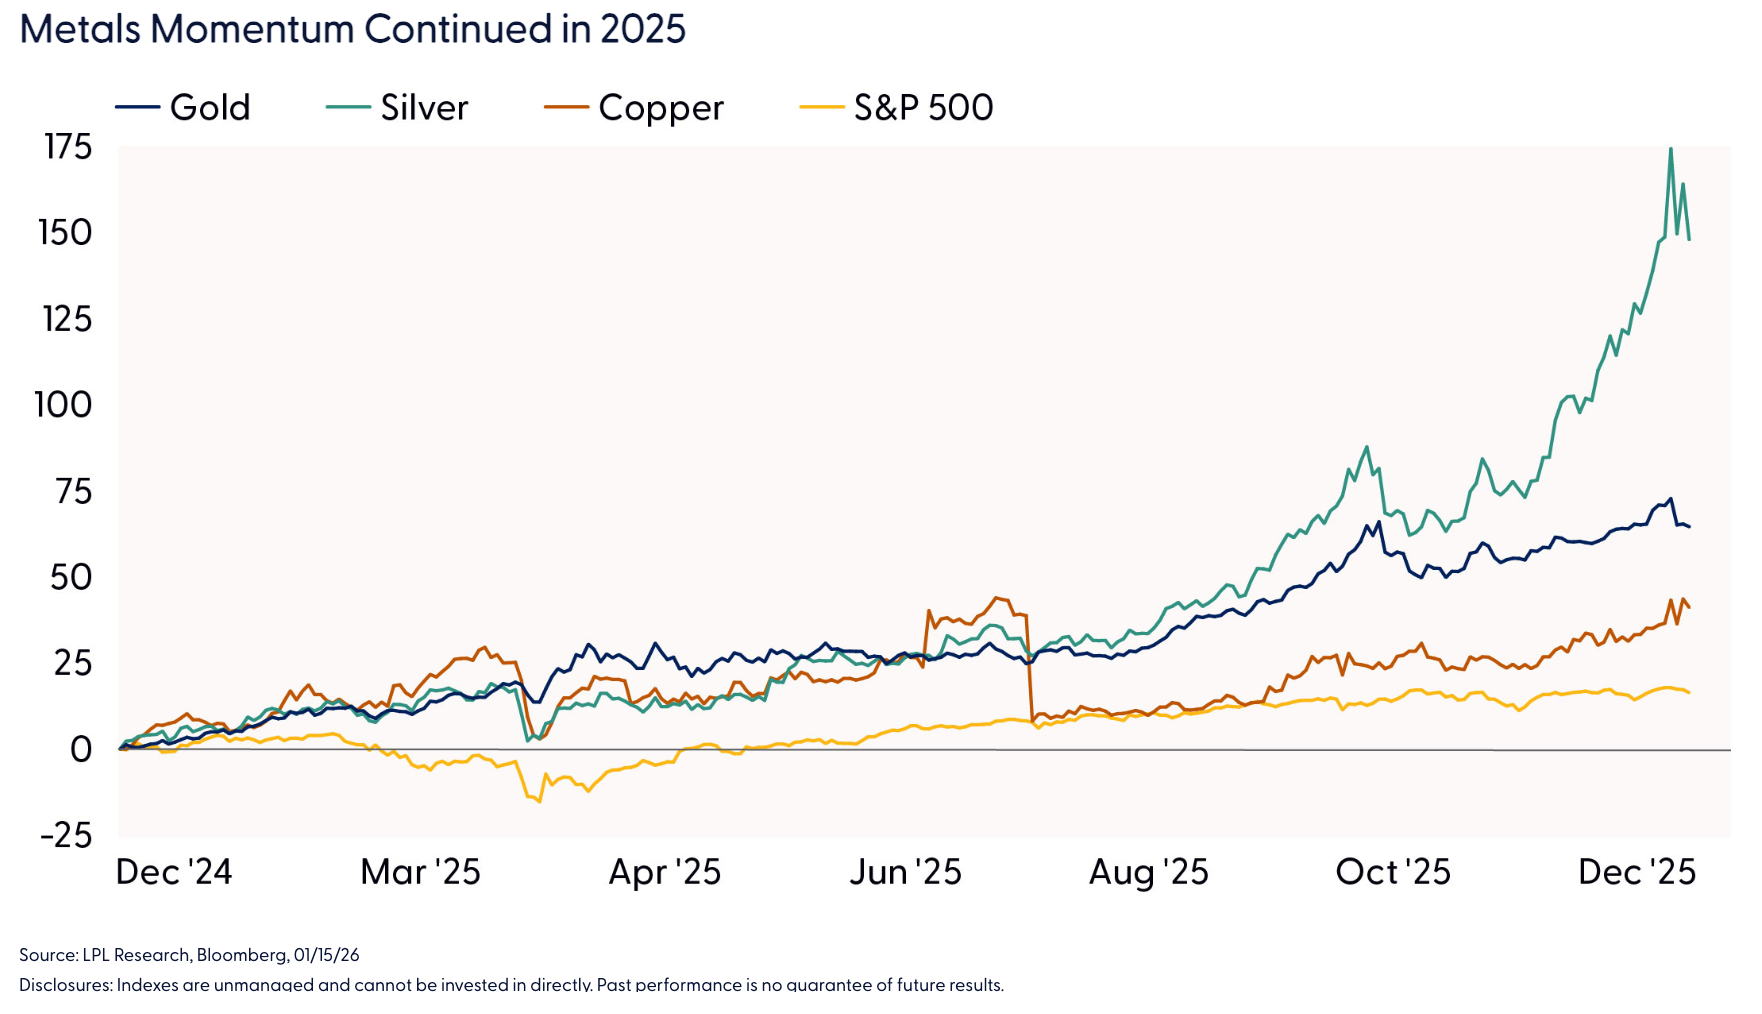
The melt‑up in the metals market that defined 2025 has extended its strength into the early weeks of the new year, reinforcing the commodity sector’s position as one of the leading asset classes across global markets. To the surprise of most, gold outperformed the broader equity market for a third consecutive year, surging roughly 65% in 2025 and far exceeding the S&P 500’s gains. Silver delivered an even more extraordinary performance, posting its best year since 1979 with annual gains near 150% and reaching generational price highs. The rally, however, cannot be attributed solely to a weaker U.S. dollar or the resumption of the Federal Reserve’s (Fed) rate‑cutting cycle in September. Policy dynamics ranging from robust central‑bank gold purchases to evolving trade and geopolitical strategies significantly influenced price action across the metals landscape. Together with structural supply shortages and rising industrial demand, these factors have created a powerful backdrop that continues to shape market volatility and performance. In this week’s Weekly Market Commentary, we explore the drivers behind the strength in metals, the associated risks, and the outlook for the durability of the rally.
Momentum Begets Momentum
The record-setting run for gold has been somewhat surprising given the backdrop of a bull market cycle in stocks. However, as we learned from Isaac Newton, an object in motion stays in motion unless acted on by an unbalanced force. For gold, the law of motion has been clear, as buyer enthusiasm for the precious metal over the last few years has not faced an equal or opposite force. Put simply, the catalysts for higher gold prices have widely outpaced downside risks — a trend we expect to continue in 2026.
Silver, or as some call it, “poor man’s gold,” stole the spotlight from gold in 2025 after delivering a remarkable 148% price return, marking the best year for the metal since the Hunt Brothers unsuccessfully tried to corner the market in 1979. Within industrial metals, copper climbed 41% amid a volatile path shaped by tariff expectations. Outside of these mainstream metals, platinum and palladium delivered notable gains of 127% and 78%, respectively, contributing to a year in which nearly all metals moved higher.

How Much Higher Can This Go?
Gold delivered a strong performance in 2024, rising 27% on the back of a steady stream of new highs. As 2025 began, investors were left questioning how much further the rally could run and how gold — an asset with no technological underpinning — could continue to outshine a market fueled by artificial intelligence (AI) enthusiasm. Today, those same questions remain. While no one has a crystal ball, technical analysis provides a framework for evaluating the relative trend between gold and equities and assessing the probability of its continuation.
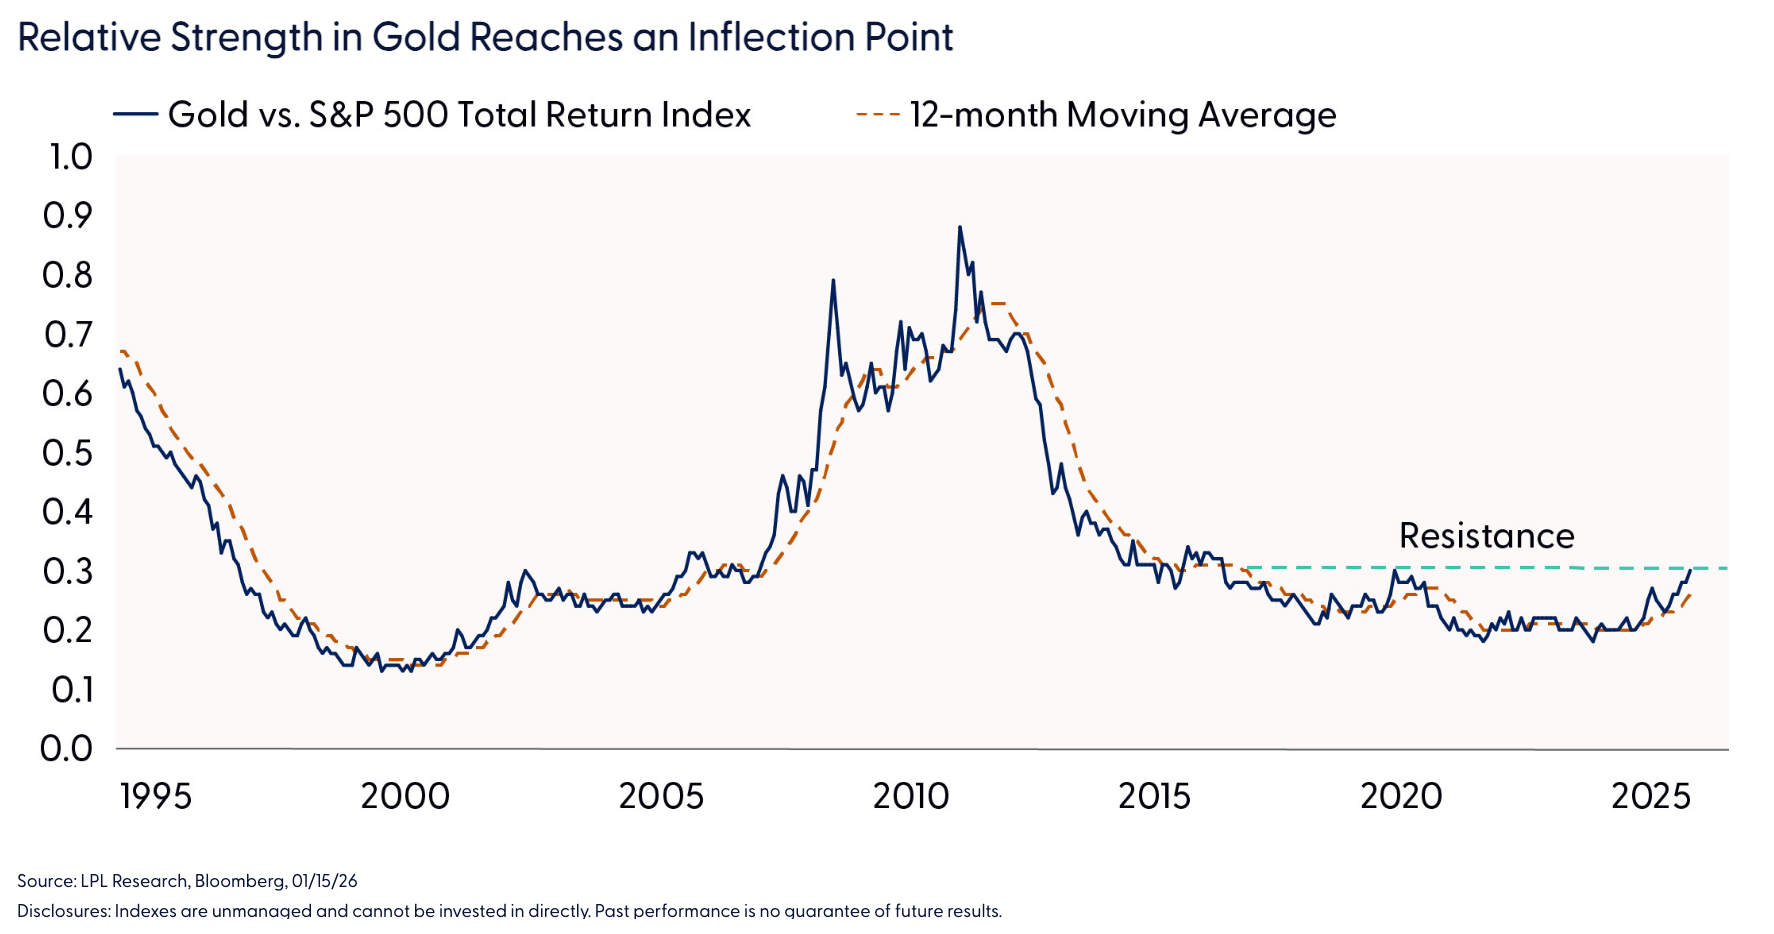
The “Relative Strength in Gold Reaches an Inflection Point” chart illustrates the long‑term relationship between gold and the S&P 500 Total Return Index over the past 30 years. A rising ratio signifies periods when gold is outperforming the broader market, while a declining ratio reflects equity leadership. The pair now sits at a critical inflection point connected by the peaks from 2015 and 2020. A breakout above this key resistance area could signal the start of a more secular phase of gold outperformance, whereas a failure to break through would suggest a renewed shift back toward equity market leadership.
New Year, Same Bullish Backdrop
Despite some recent volatility, the bullish catalysts for the metals market remain unchanged. Herein, we outline what we view as the key drivers behind our positive view on both precious and industrial metals.
-
Monetary Policy Support: We believe the Fed has room to cut rates this year and forecast an upper-bound fed funds rate of 3.25% by year-end. A slowing labor market due to weak hiring demand and easing inflation pressures primarily supports this view. Reduced interest rates should help limit upside risk in longer duration Treasury yields, and, if coupled with lower inflation, bring down real yields (which up until 2022, have been negatively correlated to gold).
-
Safe Haven Demand: Geopolitical risk remains elevated as the administration’s foreign policy evolves. President Trump’s America First policy has introduced an added risk premium to safe haven assets. Outside of the recent headlines related to Venezuela and Greenland, tensions in Iran remain high, while the Russia-Ukraine war continues with no imminent sign of a peace deal.
-
Tariffs, Trade Frictions, and Export Restrictions: While investor attention has centered on the AI arms race, an arms race in critical minerals is also unfolding as countries rush to secure supply for defense technologies. China, which produces over 90% of the world’s processed rare earths, has weaponized supplies in response to trade tensions with the U.S. and recently imposed stricter export controls on silver. While the administration has been reluctant to implement broad tariffs on critical minerals, the policy could change. For example, the White House imposed a 50% tariff on semifinished and intensive copper derivative products in August, but surprised the market by excluding refined copper from the levy. However, the exclusion may only be temporary as the administration is set to review the refined copper market again by June 30, 2026, and has floated the idea of phasing in a universal import duty on the metal by January 2027. In summary, both export restrictions and potential tariffs pose a threat to global supply.
-
Structural Supply Shortages and Global Demand Imbalances: Production outages, geopolitical supply disruptions, and chronic underinvestment in mining have constrained supply, while demand from electrification, renewable energy buildouts, and data center growth remain robust. Increasing volumes of metal flowing into the U.S. to meet industrial and strategic demand further tightened global availability and reinforced upward price momentum.
-
Follow the Money: ETF flows have become one of the most important accelerants of the metals rally. According to the World Gold Council, gold ETFs saw record global inflows of $89 billion in 2025, with holdings rising to 4,025 tonnes, the highest level since the pandemic. Silver ETFs also saw major demand spikes as fear-of-missing-out demand kicked in.
-
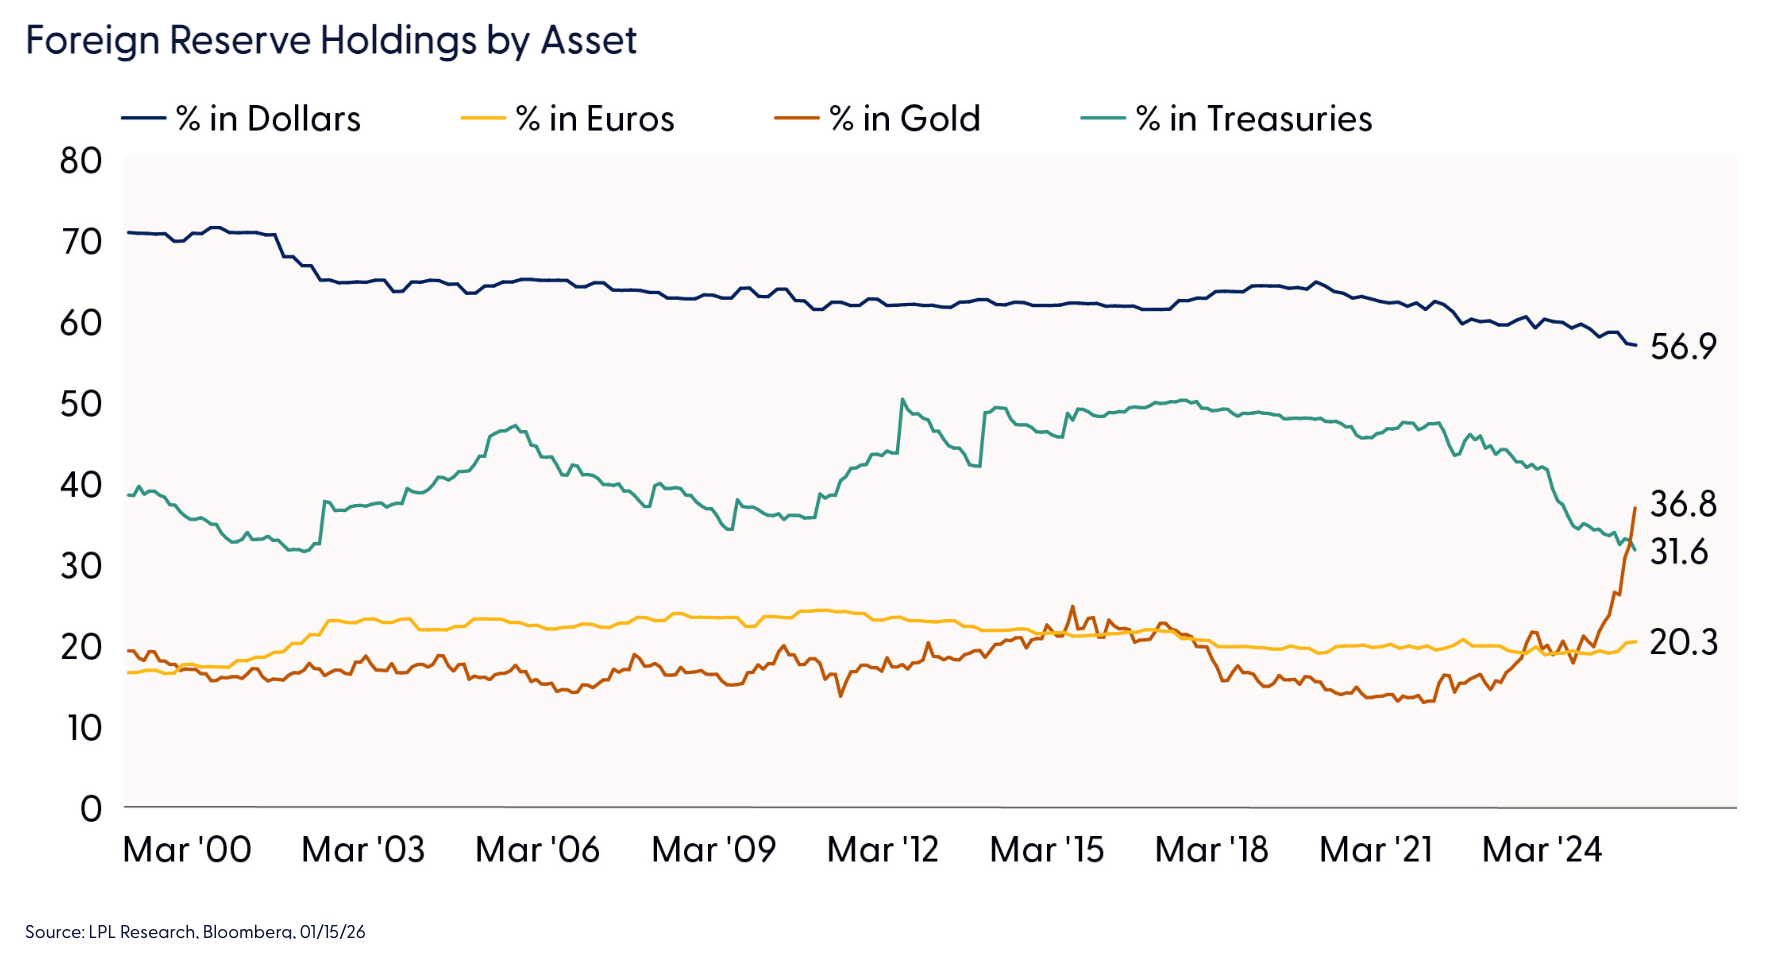
Weaker U.S. Dollar and Debasement Trends: A weaker U.S. dollar helped fuel the metals rally by making gold and silver more appealing to global investors. At the same time, mounting concerns over expansive fiscal spending, rising debt burdens, questions around Fed independence, and ongoing signs of dollar debasement added further momentum to the melt‑up in metals. Although we do not believe the dollar is at risk of losing its reserve‑currency status — given the lack of a viable alternative — central banks continue to diversify away from the greenback and U.S. Treasuries. This shift in reserve behavior traces back to the 2022 seizure of more than $300 billion in Russian dollar assets following the invasion of Ukraine, an event that reshaped perceptions of currency safety. As shown in the “Foreign Reserve Holdings by Asset,” gold has now surpassed both Treasuries and the euro as a share of global reserves, making it the second‑largest holding behind the dollar.
What About Inflation?
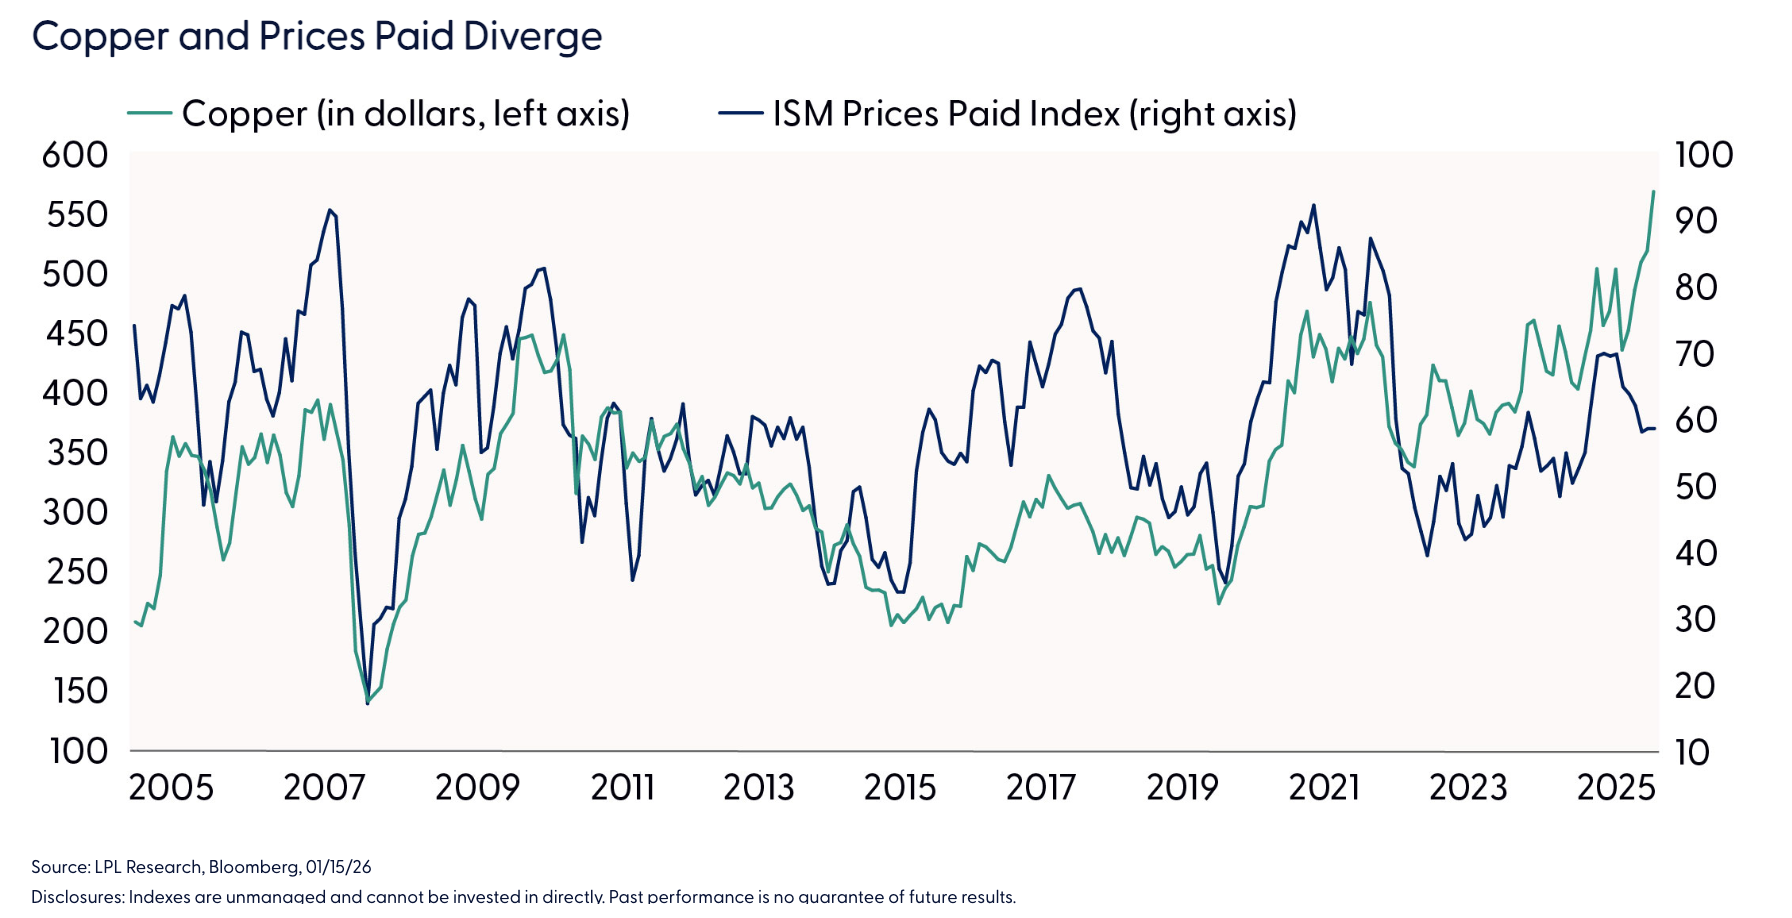
If the broader metals complex continues to rise this year, it could complicate the inflation narrative. For example, copper is a critical input across the global economy given its vast application in manufacturing, construction, electrical equipment, electronics, and energy infrastructure. It comes as no surprise that when copper prices rise, inflation tends to follow. The “Copper and Prices Paid Diverge” chart highlights this trend, which has recently diverged — pointing to upside risk in the ISM Prices Paid Index — a widely considered leading indicator for consumer prices.
The relationship between copper and inflation is further supported by International Monetary Fund (IMF) research that showed a 1% increase in copper prices raised headline and core inflation by 0.02% within 12 months, with the peak inflationary impact occurring two or three years after the supply shock. With copper up 41% last year, this means the inflation impact over the next 12 months could be close to 0.8% of overall headline and core CPI.
Conclusion
The metals market enters 2026 with strong momentum. A supportive monetary policy backdrop, elevated safe haven demand, trade frictions, and tightening global supplies all reinforce our positive outlook for both precious and industrial metals. Additionally, significant ETF inflows and a weaker dollar have amplified the rally as central banks increasingly diversify away from U.S. assets. Tactically, we continue to view pullbacks from overbought levels in the sector as allocation opportunities.
Rising metal prices may also reignite inflation pressures in the year ahead, given their historical influence on input costs across the global economy. Technical trends show gold approaching a critical long-term inflection point versus equities, suggesting the potential for continued outperformance if resistance breaks.
Investing in the metals market carries inherent risks. A stronger U.S. dollar, rising real yields, or a shift toward more restrictive monetary policy could all dampen demand. In addition, easing geopolitical tensions or greater clarity around trade and export policies may diminish safe‑haven appeal currently embedded in precious metals. Higher prices can also encourage increased production, which over time may offset the current supportive supply‑and‑demand dynamics.
Asset Allocation Insights
LPL’s Strategic Tactical Asset Allocation Committee (STAAC) maintains its tactical neutral stance on equities as 2026 begins. Investors may be well served by bracing for occasional bouts of volatility given how much optimism is reflected in stock valuations, but fundamentals remain broadly supportive. Technically, the broad market’s long-term uptrend remains intact, leaving the Committee biased to buy potential dips that emerge.
STAAC’s regional preferences across the U.S., developed international, and emerging markets (EM) are aligned with benchmarks, though an improving technical analysis picture in EM is noteworthy. The Committee still favors the growth style over its value counterpart, large caps over small caps, the communication services sector, and is closely monitoring the healthcare, industrials, and technology sectors for opportunities to potentially add exposure.
Within fixed income, the STAAC holds a neutral weight in core bonds, with a slight preference for mortgage-backed securities (MBS) over investment-grade corporates. The Committee believes the risk-reward for core bond sectors (U.S. Treasury, agency MBS, investment-grade corporates) is more attractive than plus sectors. The Committee does not believe adding duration (interest rate sensitivity) at current levels is attractive and remains neutral relative to benchmarks.
Adam Turnquist, Chief Technical Strategist, LPL Financial
Tom Shipp, Head of Equity Research, LPL Financial
Disclosures
This material is for general information only and is not intended to provide specific advice or recommendations for any individual. There is no assurance that the views or strategies discussed are suitable for all investors or will yield positive outcomes. Investing involves risks including possible loss of principal. Any economic forecasts set forth may not develop as predicted and are subject to change.
References to markets, asset classes, and sectors are generally regarding the corresponding market index. Indexes are unmanaged statistical composites and cannot be invested into directly. Index performance is not indicative of the performance of any investment and do not reflect fees, expenses, or sales charges. All performance referenced is historical and is no guarantee of future results.
Any company names noted herein are for educational purposes only and not an indication of trading intent or a solicitation of their products or services. LPL Financial doesn’t provide research on individual equities.
All information is believed to be from reliable sources; however, LPL Financial makes no representation as to its completeness or accuracy.
All investing involves risk, including possible loss of principal.
US Treasuries may be considered “safe haven” investments but do carry some degree of risk including interest rate, credit, and market risk. Bonds are subject to market and interest rate risk if sold prior to maturity. Bond values will decline as interest rates rise and bonds are subject to availability and change in price.
The Standard & Poor’s 500 Index (S&P500) is a capitalization-weighted index of 500 stocks designed to measure performance of the broad domestic economy through changes in the aggregate market value of 500 stocks representing all major industries.
The PE ratio (price-to-earnings ratio) is a measure of the price paid for a share relative to the annual net income or profit earned by the firm per share. It is a financial ratio used for valuation: a higher PE ratio means that investors are paying more for each unit of net income, so the stock is more expensive compared to one with lower PE ratio.
Earnings per share (EPS) is the portion of a company’s profit allocated to each outstanding share of common stock. EPS serves as an indicator of a company’s profitability. Earnings per share is generally considered to be the single most important variable in determining a share’s price. It is also a major component used to calculate the price-to-earnings valuation ratio.
Precious metal investing involves greater fluctuation and potential for losses.
The fast price swings in commodities will result in significant volatility in an investor’s holdings. Commodities include increased risks, such as political, economic, and currency instability, and may not be suitable for all investors.
All index data from FactSet or Bloomberg.
This research material has been prepared by LPL Financial LLC.
A message from Advisor Perspectives and VettaFi: Discover something new! Click here to register for our upcoming webcasts.
Read more commentaries by LPL Financial