LPL Research’s Strategic Asset Allocation (SAA) sits at the center of our portfolio construction process because it defines how we expect diversified portfolios to generate more stable long‑term outcomes across shifting market environments. The SAA is the long‑term plan for how major asset classes work together in a portfolio. It sets target weights for stocks, bonds, and diversifiers over a three-to-five-year horizon with the goal of improving risk‑adjusted returns through balance, valuation discipline, and purposeful diversification. We review it annually to reflect meaningful shifts in long‑run drivers like growth, inflation, interest rates, and asset class characteristics. The 2026 update seeks steady compounding by rightsizing equity risk, anchoring in high‑quality fixed income, and preserving sleeves in real assets and select alternatives so portfolios remain resilient across a range of outcomes. In this edition of the Weekly Market Commentary, we highlight some key elements of the 2026 SAA update.
#1: What is Changing in the 2026 SAA?
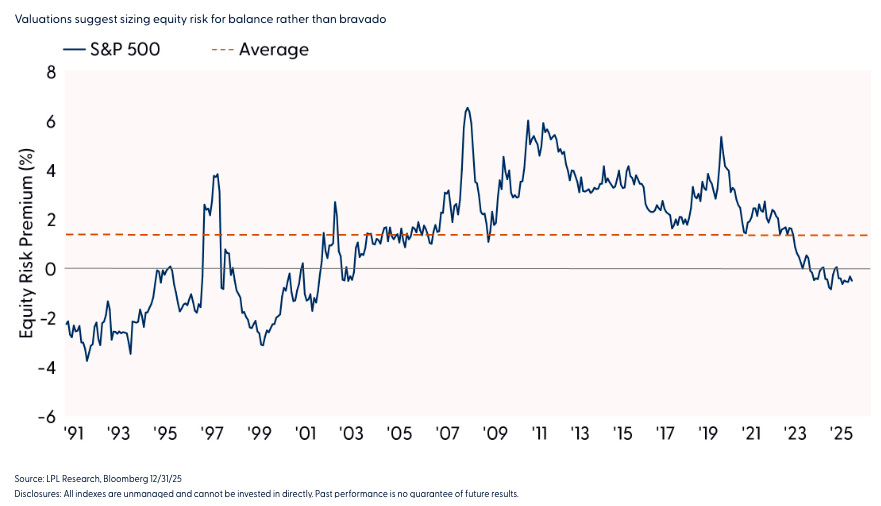
Our Strategic Asset Allocation is the long‑horizon blueprint that guides portfolios across market cycles. For 2026, we maintain a modest, but slightly reduced, underweight to total equity risk, reduced domestic small caps, increased exposure to developed international and U.S. large value equities, and maintain a purposeful allocation to real assets and select alternative investments. Core high‑quality fixed income remains the anchor. We are measured with longer-duration Treasuries given less stable correlations, which supports a more balanced risk posture at a time when the compensation for taking equity risk is fair but not abundant.
Stock Valuations Are Fair Relative to Bonds, So the Equity Risk Premium Offers Limited Compensation

#2: The Strategy Behind the Strategy
Each year LPL Research updates its Capital Market Assumptions (CMA). These long‑term return, volatility, and correlation assumptions underpin the SAA and serve as the bridge between our multi-year macro outlook and the strategic portfolio weights. The CMA translates outlooks on growth, inflation, and valuations into the disciplined set of portfolio weights in the SAA. We revisit the CMA and SAA annually because long‑term drivers and asset characteristics do evolve, even when our horizon is three to five years.
Over this time horizon, the SAA is built to be durable, not delicate. We blend multiple independent signals in a Black‑Litterman1 framework and validate model outputs against the LPL Research Strategic and Tactical Asset Allocation Committee’s (STAAC) outlook before finalizing weights. This process helps ensure no single viewpoint dominates the allocation and that portfolios reflect a balanced and diversified set of long‑term drivers.
The aim is that each building block must either improve expected returns or reduce expected risk versus our diversified benchmarks. LPL Research evaluates asset classes for sensitivity to many factors, which may influence the expected returns of equities, fixed income, diversifying strategies, and cash over a strategic investment horizon, including economic growth, inflation, interest rates, business cycle, valuations, fundamentals, geopolitical risk, volatility, and dispersion. Higher cross‑asset dispersion increases the value of strategies that can respond to divergent trends
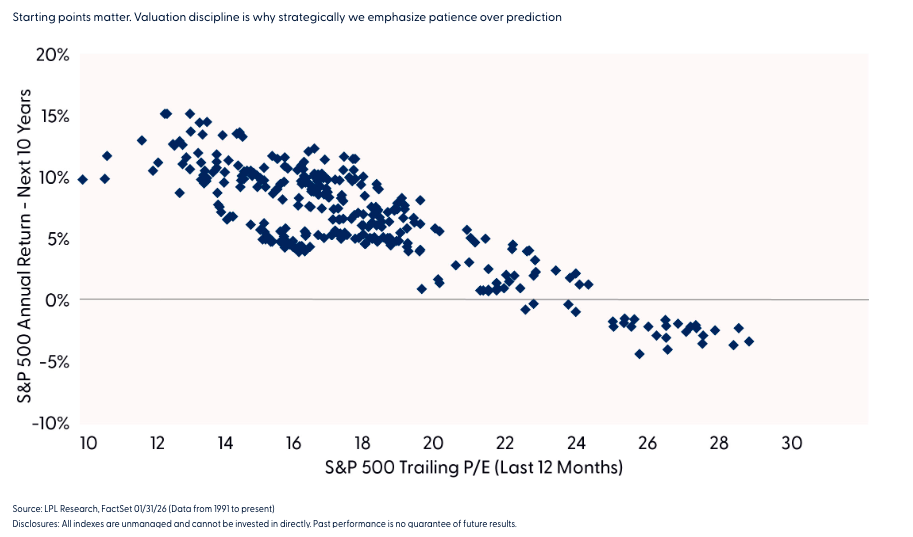
Valuations play a particularly critical role in our strategic framework, as historically they have demonstrated a high correlation with long-term market performance. The price-to-earnings ratio (P/E) for the S&P 500 Index, for example, has shown predictive power for subsequent decade-long returns, with higher P/Es typically preceding weaker long-term performance and lower P/Es often followed by stronger results. This relationship between starting valuations and subsequent returns supports patience and informs how we size risk exposure and tilt across styles within the SAA context.
1 This approach “allows us to generate optimal portfolios that start at a set of neutral weights and then tilt in the direction of the investor’s views”. Black, Fischer, and Robert Litterman. “Global Portfolio Optimization.” Financial Analysts Journal 48, no. 5 (1992): 28–43. www.jstor.org/stable/4479577
Stock Valuations Have Been Good Predictors of Long‑Term Returns
#3: Equity Positioning for this Cycle
Within the 2026 SAA, we retain meaningful equity exposure but keep it modestly below benchmark exposure levels. We increase U.S. large-value and developed international equities where starting valuations, income, and stability characteristics strengthen the long‑run strategic investment case. We trim small cap equities to balance return potential with volatility, acknowledging a tighter risk-reward today, but we still believe in their role over full market cycles and keep a material overweight relative to a purely global market cap baseline. Reducing small caps modestly allows the portfolio to benefit from their long‑term potential while avoiding excess volatility during periods when quality and income characteristics in larger‑cap markets seem more compelling. The result in this vintage of the SAA is a steadier mix of equities that relies less on a narrow set of increasingly concentrated outcomes and more on diversified drivers of return.
The strategic lens through which we view the SAA is intentionally insulated from week‑to‑week, and especially day-to-day, narratives. Even as headlines swing (sometimes intra-day) from AI enthusiasm to disruption worries, the SAA stays anchored in valuations, cash flow durability, and cross‑asset relationships that matter over multiple years. This helps prevent short‑term sentiment swings from pulling long‑horizon portfolios off course. We believe that recognizing and aligning the likely time horizon of investment drivers and the desired model investment time horizon, strategic or tactical, is a cornerstone of effective portfolio management. Sometimes our strategic and tactical views diverge due to the difference of emphasis that each place on valuations, fundamentals, and technicals.
#4: Fixed Income: Diversification, Liquidity, and Income
The bond sleeve does three jobs for strategic investors — it provides income, it supplies liquidity, and through diversification it offers ballast when risk assets stumble. We emphasize high‑quality core taxable bonds, and, for tax‑aware investors, investment‑grade municipals can stand in for the core sleeve where appropriate. We keep duration (interest-rate sensitivity) from dominating the defense and let the core sleeve do what it does best and provide risk mitigation in ordinary financial market corrections, something that longer-duration fixed income may not do. Recent years have shown that stocks and longer‑duration bonds can sell off together, which is why we avoid overly relying on duration for downside risk mitigation. As such, our strategic stance recognizes a range of inflation outcomes and less stable stock‑bond correlations. We maintain a measured stance on long nominal Treasuries and prefer short‑duration Treasury Inflation- Protected Securities (TIPS) as a tool for hedging upside inflation surprises over a three-to-five-year horizon. While spreads remain tight, we are also careful about reaching for yield in non‑core segments of fixed income markets (unless above benchmark yield is a specific portfolio goal).
#5: Diversifiers That Earn Their Keep
Diversification is intentional, not ornamental. We maintain exposure to real assets and a focused lineup of alternative investments because each brings a distinct job to the portfolio. Real assets, including commodities and global listed infrastructure, help address inflation and provide different growth sensitivities. Their role is especially important in an environment where inflation has moderated but remains influenced by structural forces. Alternative investments, such as multi‑strategy, global macro, and managed futures, can reduce volatility, help during periods of trend divergence, and mitigate concentration risk. We hold these asset classes because they either improve expected returns or reduce expected risk, not because they are fashionable.
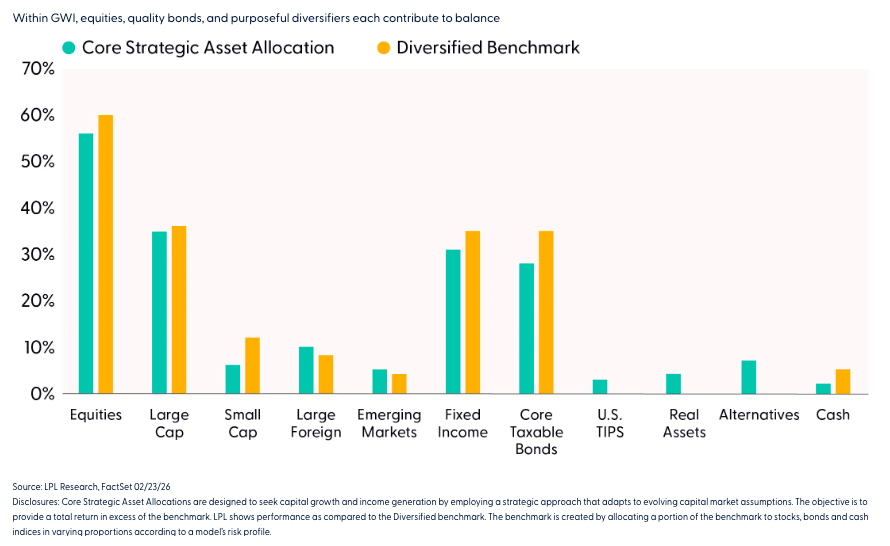
The Growth with Income (GWI) balanced 60/40‑style investment objective of the SAA shows how equities, quality bonds, and diversifiers share the work from a portfolio perspective. This core portfolio highlights how equity exposure drives long‑term return potential, how core fixed income provides income and stability, and how real assets and alternatives help manage inflation and volatility so the mix can compound more steadily over a full market cycle. These diversifiers play an important role when traditional stock‑bond relationships behave unusually, offering additional pathways for portfolios to navigate shifting macro conditions.
LPL Research Strategic Asset Allocation, Growth with Income (GWI) 60/40
Conclusion
LPL Research's 2026 SAA update steers investors to maintain a modest underweight to equity risk, tilting exposures to large cap value and international equities, and continuing to allocate to a dedicated exposure to a diversifying basket of real assets and alternative investments.
Strategic allocation is about robustness over extended periods, not precision over short ones. Through our combination of qualitative insight and quantitative discipline, we build allocations for a range of outcomes, validate the inputs each year, and let time, income, and disciplined rebalancing do the heavy lifting. That is how the SAA aims to compound steadily over the next three to five years.
LPL clients can speak to their financial advisor about implementing these insights through LPL Research's strategic models that are available on our managed account platforms, including Model Wealth Portfolios (MWP). These platforms offer flexibility to emphasize LPL Research’s strategic views while also tailoring accounts to individual investment objectives and risk tolerances.
George Smith, Portfolio Strategist, LPL Financial
Craig Brown, Head of Quant Research, LPL Financial
You may also be interested in:
A message from Advisor Perspectives and VettaFi: Discover something new! Click here to register for our upcoming webcasts.
Disclosures
This material is for general information only and is not intended to provide specific advice or recommendations for any individual. There is no assurance that the views or strategies discussed are suitable for all investors or will yield positive outcomes. Investing involves risks including possible loss of principal. Any economic forecasts set forth may not develop as predicted and are subject to change.
References to markets, asset classes, and sectors are generally regarding the corresponding market index. Indexes are unmanaged statistical composites and cannot be invested into directly. Index performance is not indicative of the performance of any investment and do not reflect fees, expenses, or sales charges. All performance referenced is historical and is no guarantee of future results.
Any company names noted herein are for educational purposes only and not an indication of trading intent or a solicitation of their products or services. LPL Financial doesn’t provide research on individual equities.
All information is believed to be from reliable sources; however, LPL Financial makes no representation as to its completeness or accuracy.
All investing involves risk, including possible loss of principal.
US Treasuries may be considered “safe haven” investments but do carry some degree of risk including interest rate, credit, and market risk. Bonds are subject to market and interest rate risk if sold prior to maturity. Bond values will decline as interest rates rise and bonds are subject to availability and change in price.
The Standard & Poor’s 500 Index (S&P500) is a capitalization-weighted index of 500 stocks designed to measure performance of the broad domestic economy through changes in the aggregate market value of 500 stocks representing all major industries.
The PE ratio (price-to-earnings ratio) is a measure of the price paid for a share relative to the annual net income or profit earned by the firm per share. It is a financial ratio used for valuation: a higher PE ratio means that investors are paying more for each unit of net income, so the stock is more expensive compared to one with lower PE ratio.
Earnings per share (EPS) is the portion of a company’s profit allocated to each outstanding share of common stock. EPS serves as an indicator of a company’s profitability. Earnings per share is generally considered to be the single most important variable in determining a share’s price. It is also a major component used to calculate the price-to-earnings valuation ratio.
Precious metal investing involves greater fluctuation and potential for losses.
The fast price swings in commodities will result in significant volatility in an investor’s holdings. Commodities include increased risks, such as political, economic, and currency instability, and may not be suitable for all investors.
The NASDAQ Composite Index measures all NASDAQ domestic and non-U.S. based common stocks listed on The NASDAQ Stock Market. The market value, the last sale price multiplied by total shares outstanding, is calculated throughout the trading day, and is related to the total value of the Index. Indexes are unmanaged and cannot be invested in directly.
The MSCI US Broad Market Index captures broad U.S. equity coverage. The index includes 3,204 constituents across large, mid, small and micro capitalizations, about 99% of the U.S. equity universe. Indexes are unmanaged and cannot be invested in directly.
All index data from FactSet or Bloomberg.
This research material has been prepared by LPL Financial LLC.
RES-0006657-0126 | For Public Use | Tracking #1068441 | #1068443 (Exp. 02/2027)
Read more commentaries by LPL Financial