The post-pandemic economy is about to turn six years old. To say it's unique and strange is perhaps the ultimate understatement. The United States (and much of the globe) has weathered an inflation shock not seen in decades, a manufacturing recession and (currently) an artificial intelligence (AI) revolution—all while markets have continued to do well and economic growth largely has been uninterrupted. Increasingly missing in the puzzle has been a strong labor market, or at least the firm hiring backdrop typically associated with economic expansions.
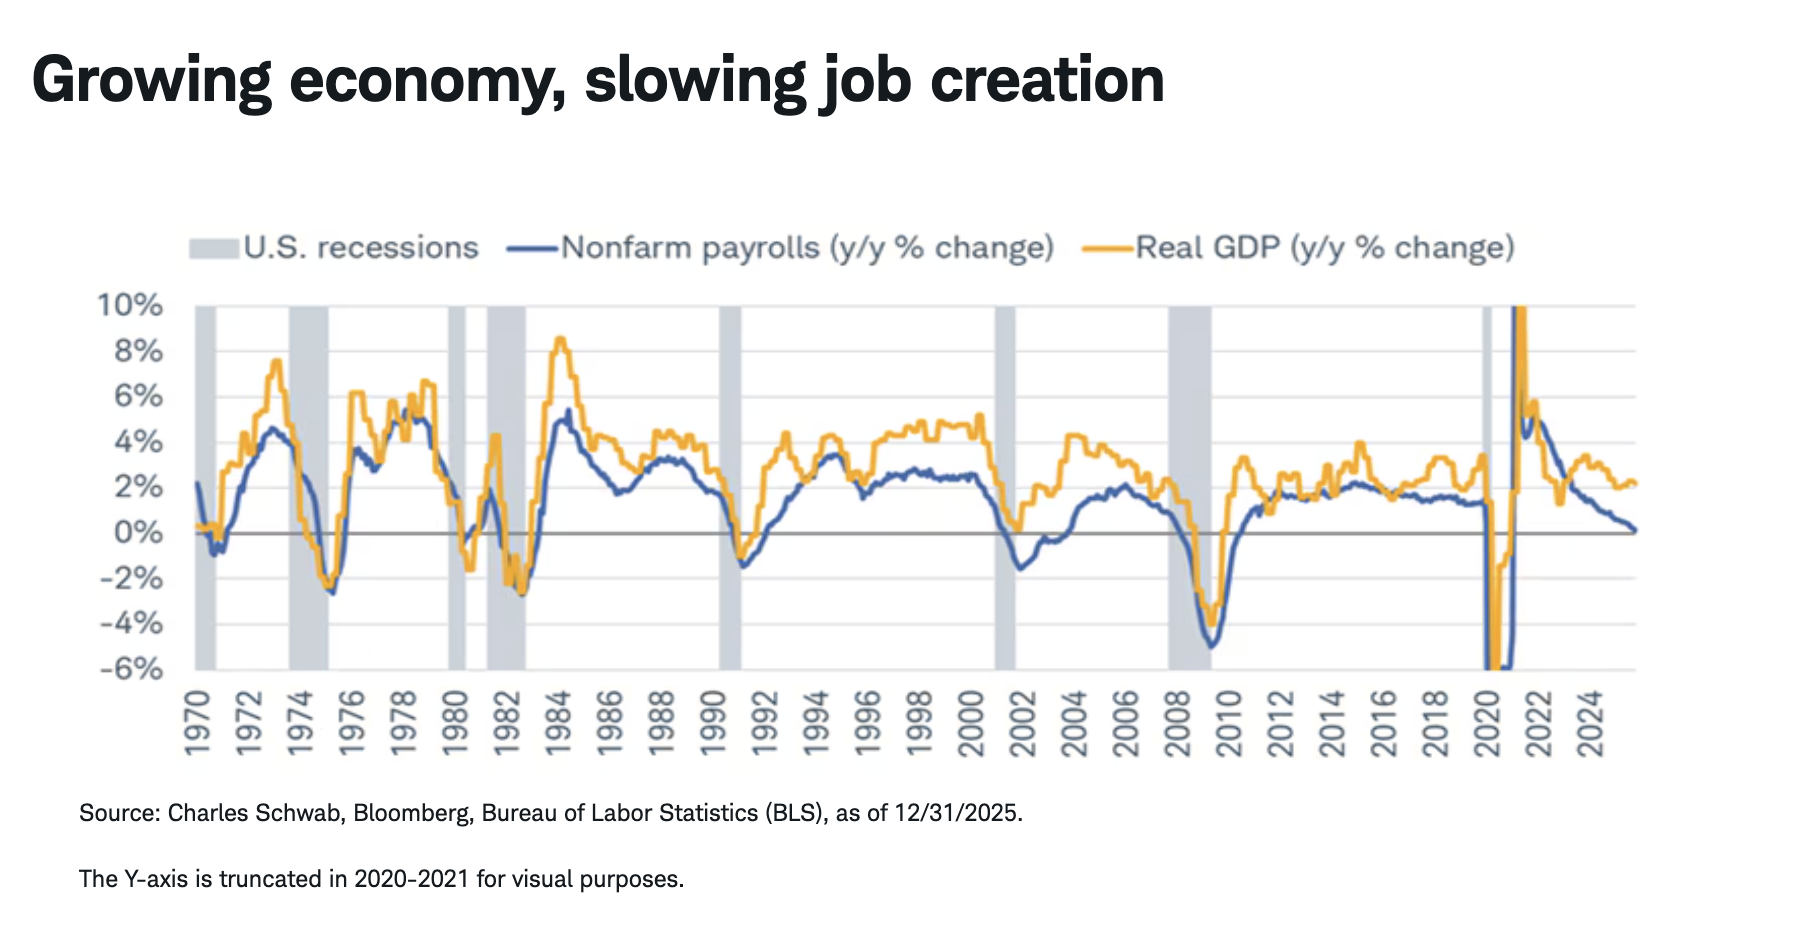
Now that we have the full set of both gross domestic product (GDP) and nonfarm payroll data for 2025 (worth noting is that GDP will be revised), we know that we're in an exceptionally puzzling time of resilient GDP growth and incredibly weak (if any) job growth. With the annual benchmark revisions from the Bureau of Labor Statistics (BLS) now in hand, we know that the economy added only 181,000 jobs last year. For context, in all years going back to the 1940s in which we have seen net job creation, the only year worse than 2025 was 2003. As shown in the chart below, the year-over-year (y/y) change in real (that is, inflation-adjusted) GDP was 2.2% at the end of 2025, while payroll growth came in at just 0.1% y/y.

A quick glance at prior recessions and the blue line sparks instant concerns about an economy that is poised to enter a recession soon—not least because in prior slowdowns, payroll growth has led GDP growth. Yet, the divergence between both has been widening for several years, calling into question their relationship and posing the big question of whether we are in a jobless expansion.
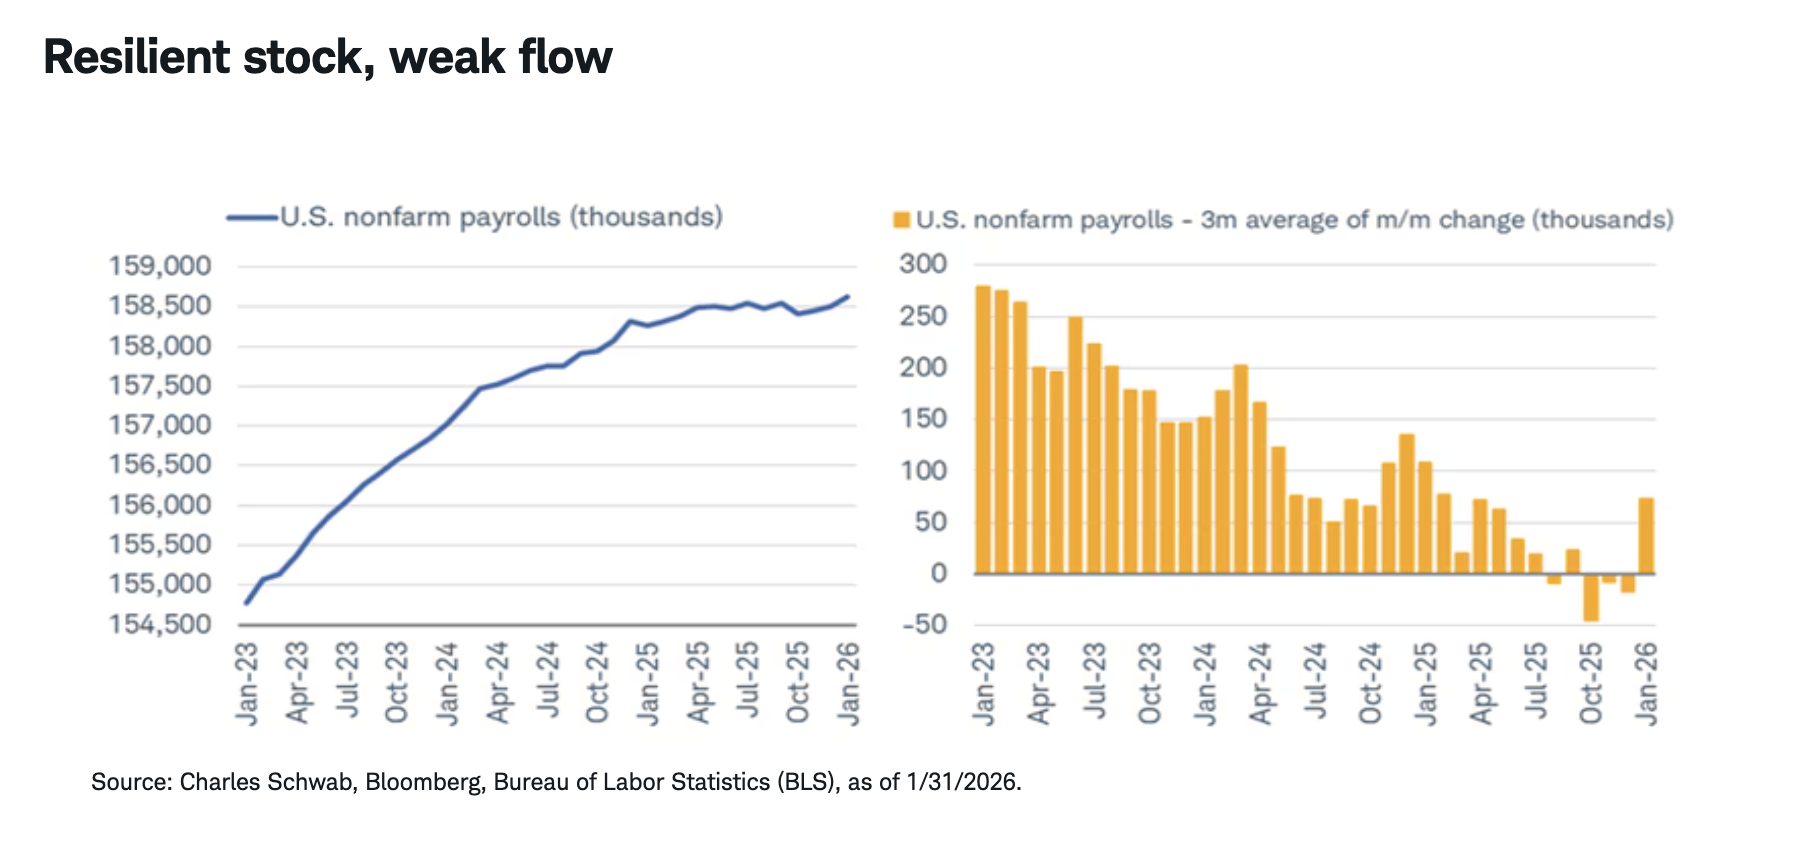
The short answer is (mostly) yes, but there are caveats. Of course, to say the economy is in a jobless state might imply there are a dearth of jobs. This is far from the case given total nonfarm payrolls rose to an all-time high in January. This brings in the important distinction between stock and flow. The number of payrolls has continued to climb over the past several years, reaching record after record, shown via the blue line in the chart below. Yet, the pace of those increases has weakened considerably (the flow has slowed), shown via the yellow bars.
What gives?
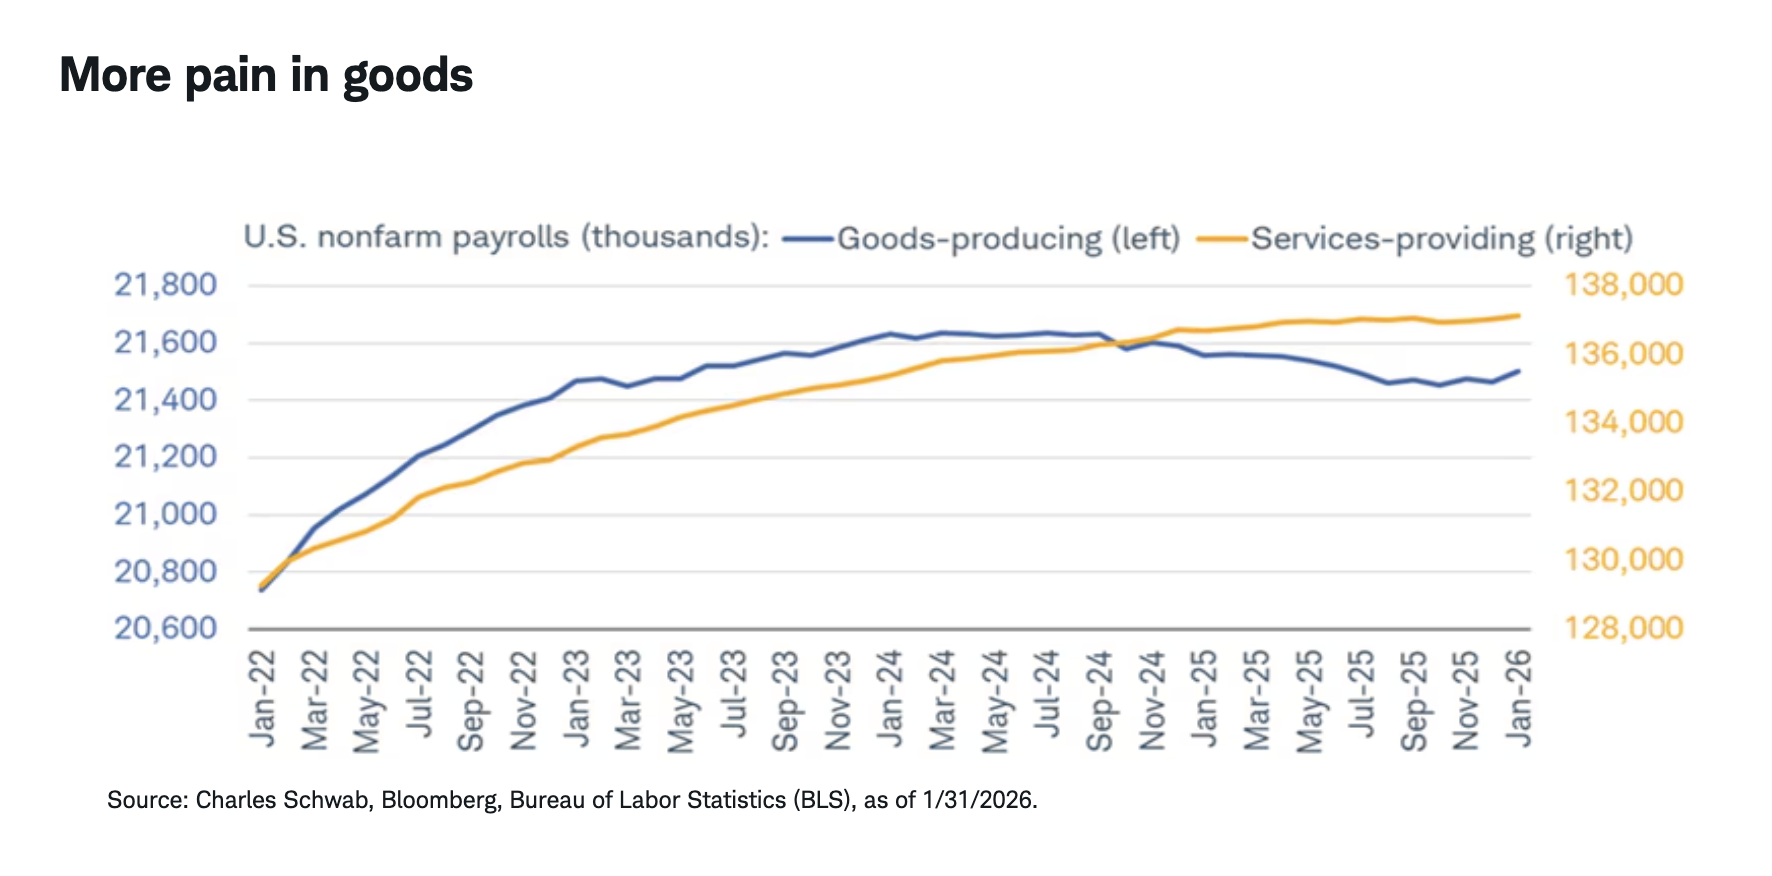
There are both cyclical and structural factors at play when it comes to the GDP-jobs divergence. Starting with the former, the manufacturing- and goods-oriented segments of the economy have been under pressure in the post-pandemic era, with much of the stress stemming from the swift nature in which the global economy reopened and services demand rebounded. That led to an eventual halt in goods-producing jobs, which was then exacerbated further by the trade war that started in early 2025, as you can see via the blue line in the chart below.
Conversely, services-providing job growth largely has been undisturbed. Save for a minor speed bump toward the end of 2025, payrolls in the services world have climbed over the past few years and reached a record high in January. Given services' dominance in the economy, the lack of material weakness helped bolster broader payrolls and, in turn, overall GDP.
The January jobs report underscored some glimmers of hope for the goods sector, evidenced by the bounce back in manufacturing and construction jobs—not to mention the fact that the Institute for Supply Management (ISM) Purchasing Managers Index (PMI) surged into expansion territory for the month. As tariff uncertainty has faded at the margin (but not disappeared altogether), the cyclical-oriented segments of the economy have had some time to catch their breath.
By definition, cyclical pressures come and go; we don't expect them to hang around forever. Thus, it's important to consider the structural forces putting downward pressure on potential payroll growth and keeping GDP growth in firm territory. Chief among these are worsening demographics and a significant slowdown in net migration.
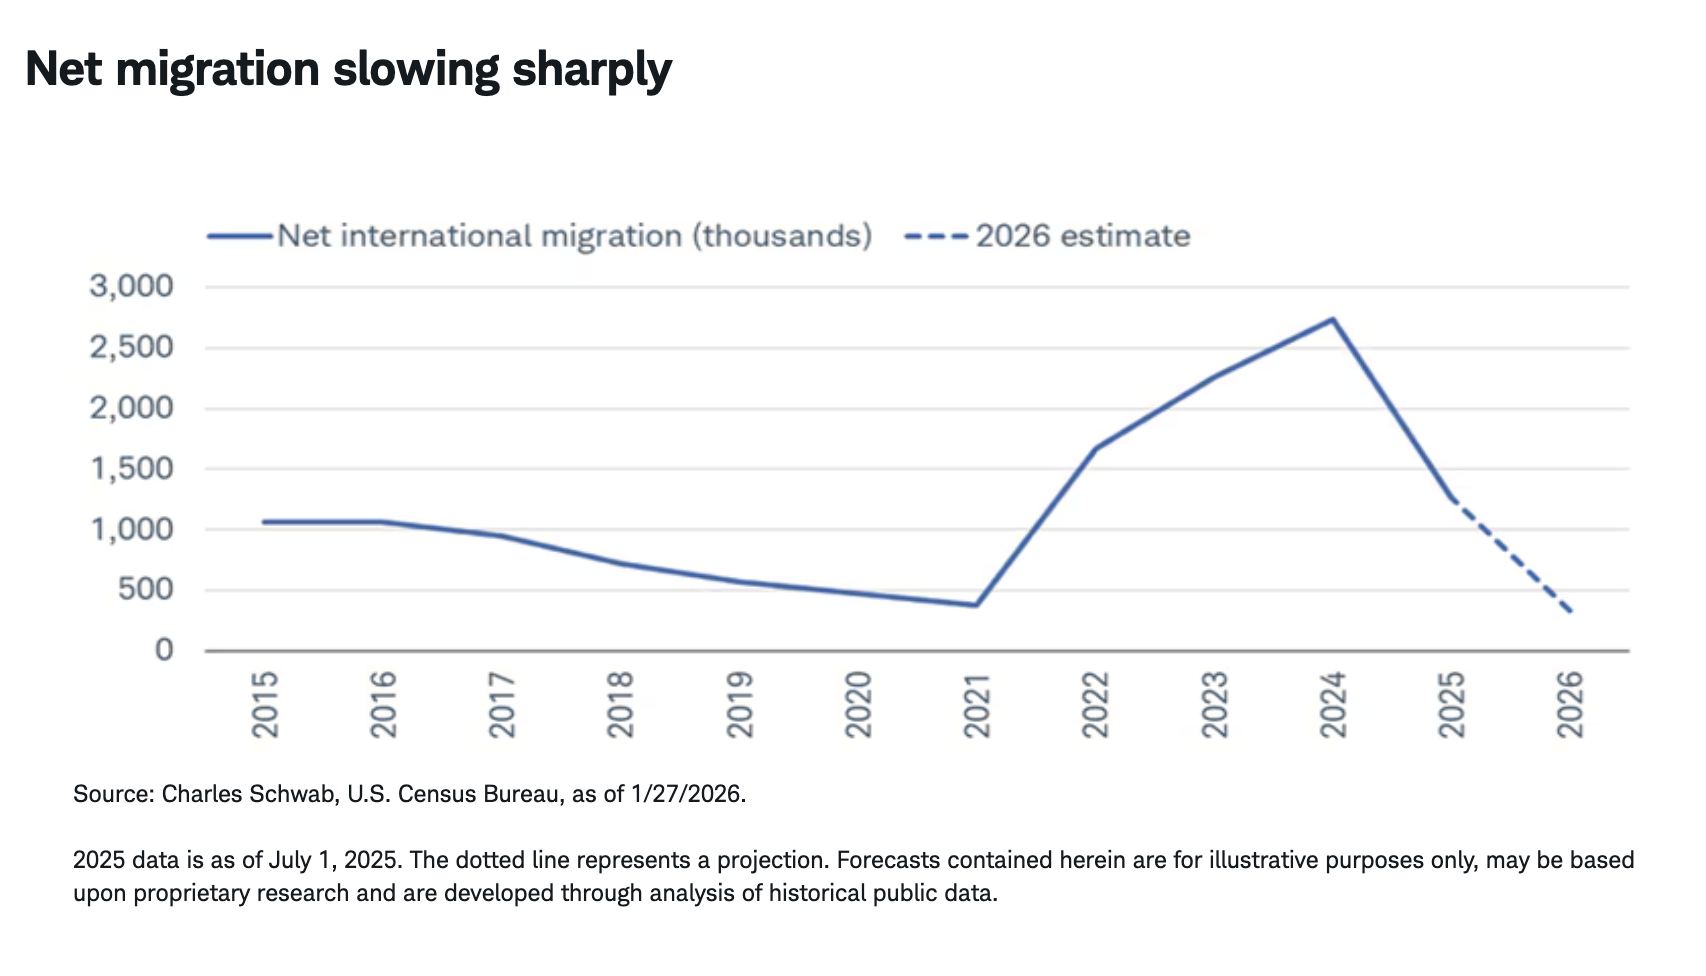
As the United States and much of the developed world continue to see societies age and birth rates fall, potential labor force growth weakens considerably. That is exacerbated by the fact that net migration flows into the United States have slowed sharply. The latest data from the Census Bureau show that net international migration slowed from 2.7 million people in 2024 to 1.3 million people in 2025. Estimates for 2026 are quite low at just 321,000 based on current trends. If that holds, it will mark a significant and historic decline in net migration.
Given our aging population and increased reliance on immigrants to grow our workforce, we are seeing meaningful downward pressure on potential labor force growth, which means the so-called breakeven pace of payroll growth—the number of jobs we need to create each month without seeing a move in the unemployment rate—has likely fallen considerably. Estimates vary, but as recently as October 2025 the Federal Reserve Bank of Dallas noted the pace might be as low as 30,000 jobs. That is a dramatic move lower relative to what is considered normal in economic expansions.
The elephA(I)nt in the room
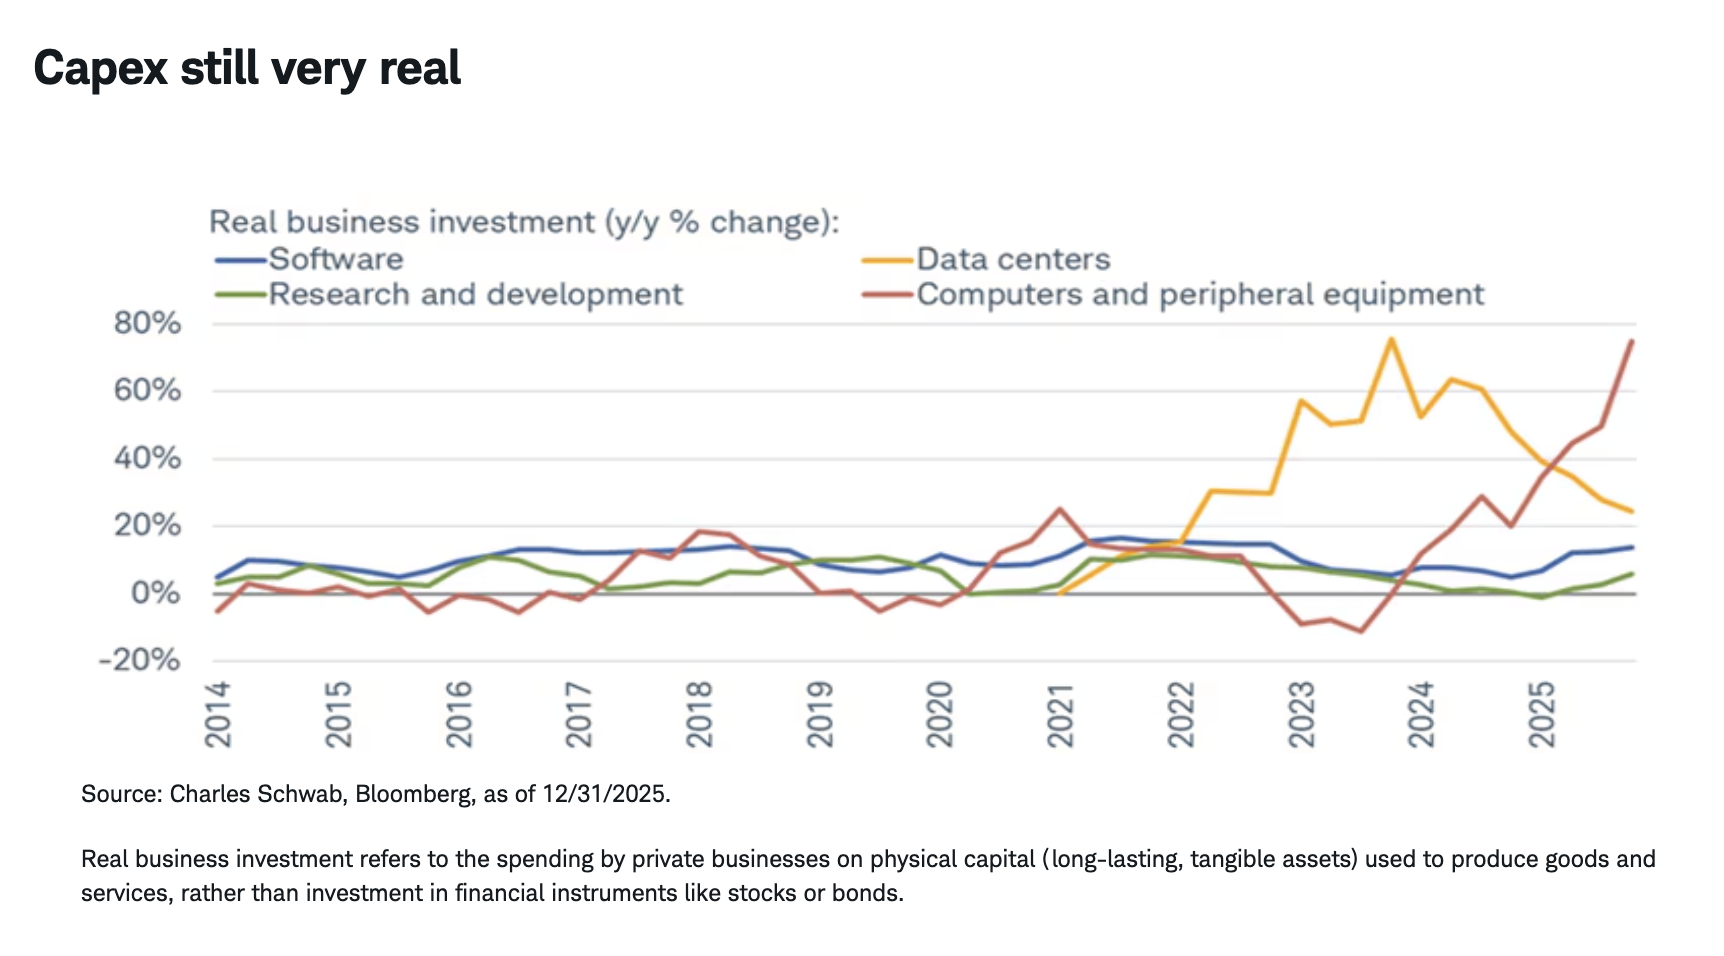
At the most basic level, GDP growth is the sum of labor force and productivity growth. With the former not doing much (if any) heavy lifting, we have to rely on the latter. Fortunately, productivity growth hasn't yet let us down given it strengthened throughout 2025. Companies cut costs aggressively by pulling back on hiring while maintaining solid levels of output. At the same time, the AI boom continued, with investment in data centers and computers continuing to soar. As you can see in the chart below, even though year-over-year growth in data center investment has continued to slow, it remained above 20% in the fourth quarter of 2025; while computer and equipment investment spiked to nearly 80%.
It's worth busting the myth that the economy wouldn't have grown last year without the AI investment boost. Yes, the contribution from private sector investment was significant—especially in the first half of the year—but it wasn't the only game in town. Consumer spending growth averaged 2.3% throughout 2025—certainly not the strongest year, but also not as bad as originally feared.
A vibepression, continued
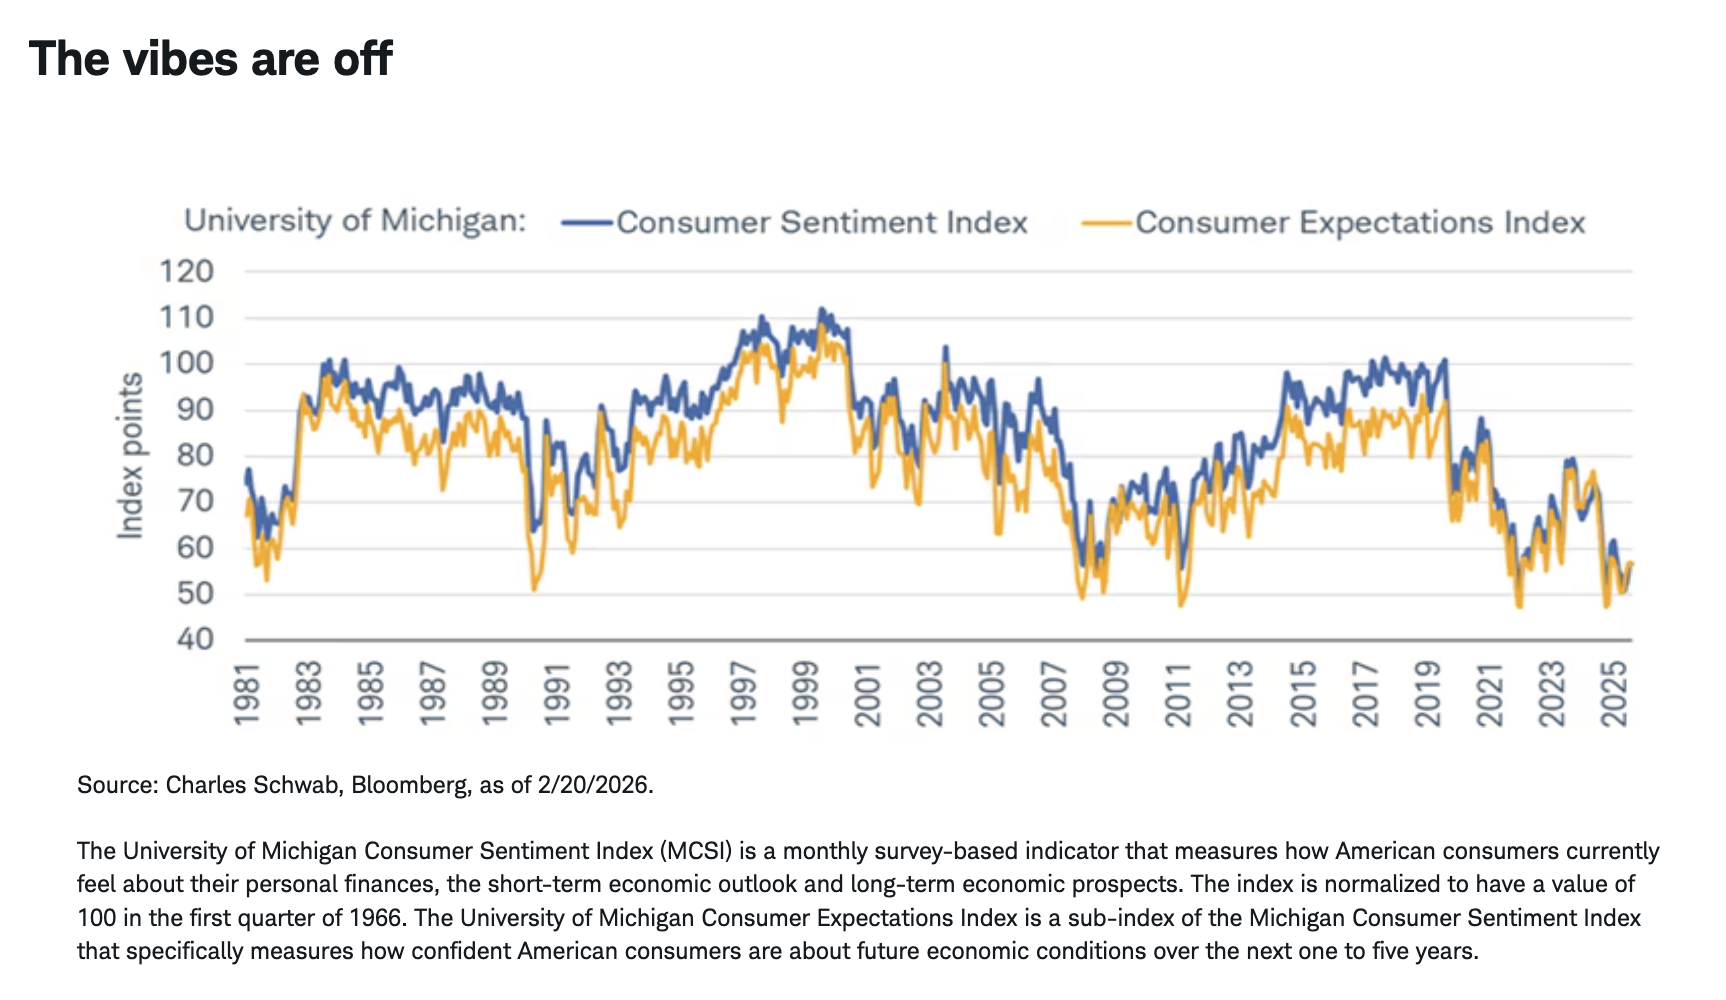
The surge in AI capital expenditures (capex), slowdown in job growth, and steady consumer spending are all very central to the "vibepression" term I coined last year, which underscores persistently dour consumer sentiment despite a growing economy. Central to this theme is the fact that despite AI capex soaring well into double-digit territory and the stock market also delivering double-digit returns for the past several years, consumers don't all feel well about the economy. In fact, a good chunk of them say it feels just as bad, if not worse, as the depths of the pandemic and/or during the global financial crisis nearly two decades ago—per the Consumer Sentiment Index from the University of Michigan.
The vibepression was initially driven by the surge in inflation on the heels of both the pandemic and Russia's invasion of Ukraine—both of which helped send growth in the consumer price index (CPI) to rates that many consumers have never seen. Exacerbating that has been the second phase: softening job growth and concerns that AI will lead to mass unemployment. To me, it's still too early to have high conviction that AI has become the ultimate job disruptor or displacer. The two industries that saw the largest downward revisions to payroll growth in the 2025 benchmark revisions were Information (the tech sector) and Wholesale Trade. There is of course a potential AI effect at play with the former, but likely more of a trade war impact with the latter.
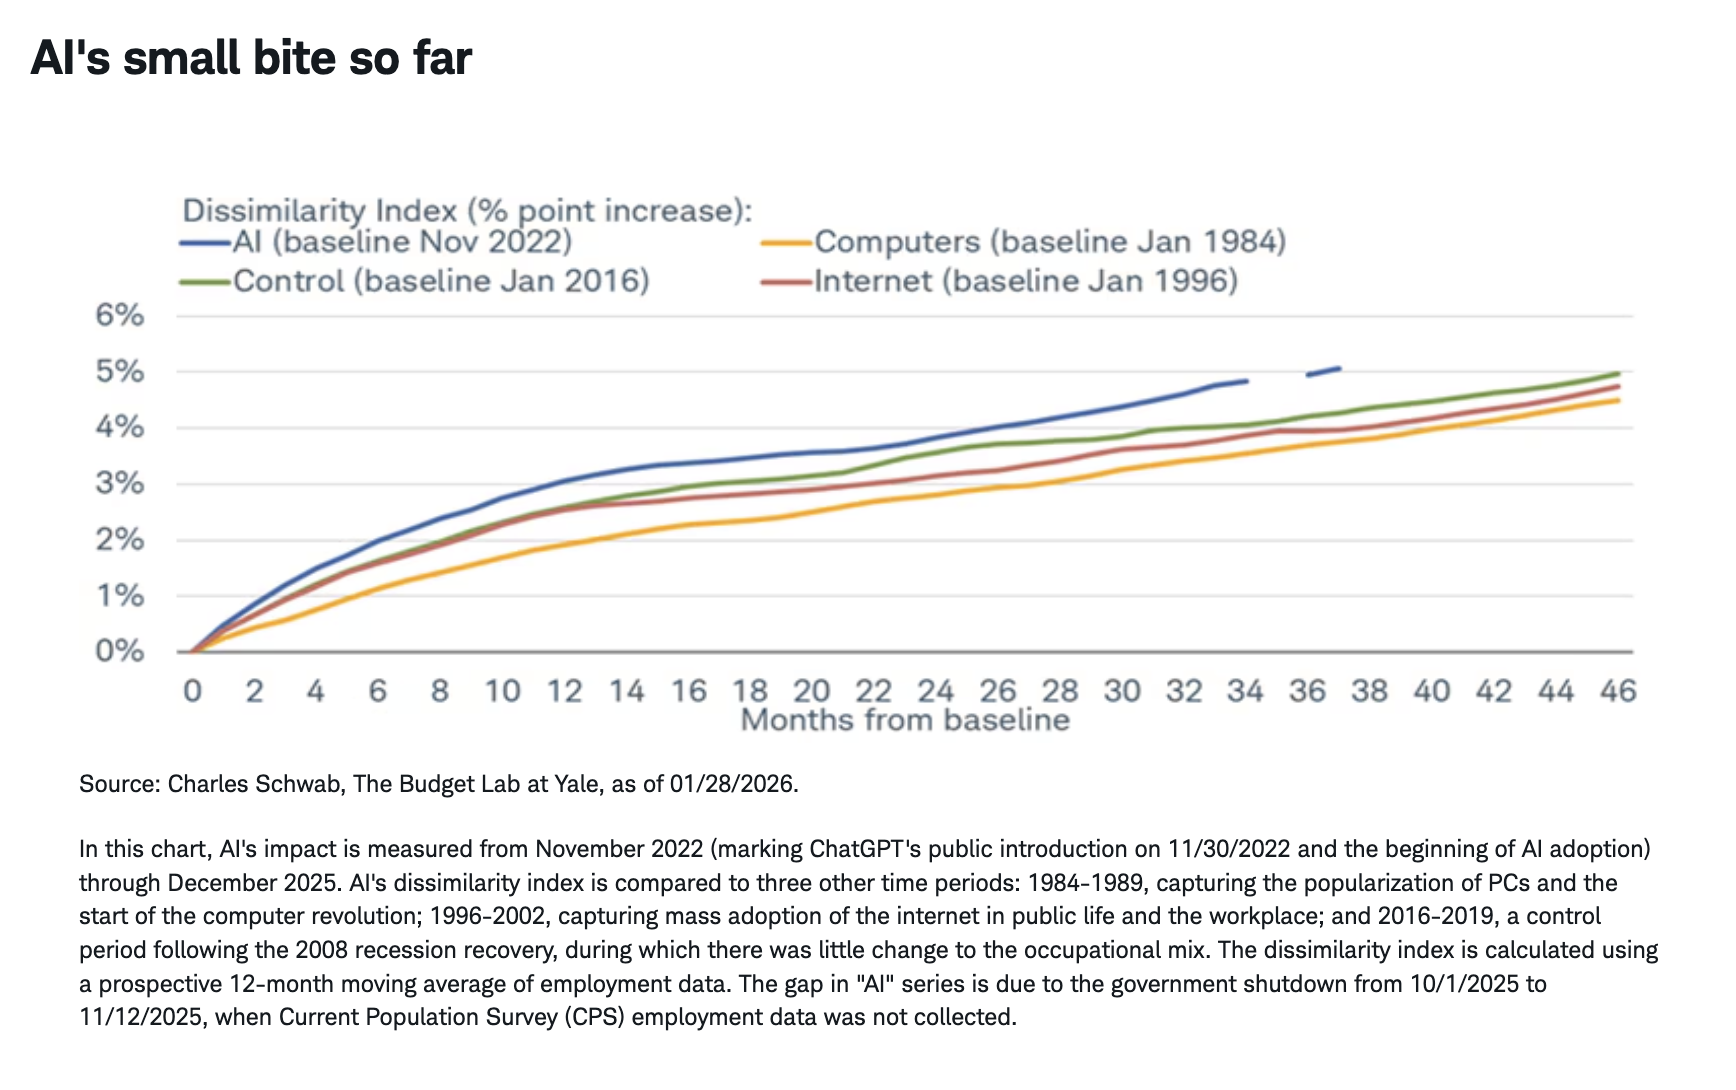
One way to see how much (or little) AI is impacting the job market is via a dissimilarity index, which measures the change in occupational mix over any given period. Analysis from the folks at Yale's Budget Lab has reinforced the fact that since the release of ChatGPT in 2022, the increase in dissimilarity hasn't been remarkably different compared to the introduction of the computer or internet. The mix has changed at a faster pace, but if current AI fears were being reflected in actual labor data, the blue line in the chart below would already be rising at a much sharper pace.
Survey says
Putting this all together, we have what I think of as the ultimate oxymoronic environment. Resilient GDP and a weak labor market make for an economy that looks remarkable and grim at the same time, especially as consumer sentiment remains dour and completely out of sync with an economy that continues to grow each quarter. As we wrote in our 2026 outlook, we do think there is room for the labor market to stabilize and rebound this year, but for the reasons outlined in this report, the recovery might be uncomfortably weak. The vibepression suggests that public angst around inflation and the labor market won't subside quickly, which means the process of adjusting to a new normal will likely be drawn out. To be sure, the landscape today isn't outright bad, it's just different.
This material is intended for general informational and educational purposes only. This should not be considered an individualized recommendation or personalized investment advice. The investment strategies mentioned are not suitable for everyone. Each investor needs to review an investment strategy for his or her own particular situation before making any investment decisions.
All expressions of opinion are subject to change without notice in reaction to shifting market, economic or political conditions. Data contained herein from third party providers is obtained from what are considered reliable sources. However, its accuracy, completeness or reliability cannot be guaranteed.
Past performance is no guarantee of future results.
Investing involves risk, including loss of principal.
All corporate names and market data shown are for illustrative purposes only and are not a recommendation, offer to sell, or a solicitation of an offer to buy any security.
The policy analysis provided by the Charles Schwab & Co., Inc., does not constitute and should not be interpreted as an endorsement of any political party.
Indexes are unmanaged, do not incur management fees, costs, and expenses and cannot be invested in directly. For more information on indexes, please see schwab.com/indexdefinitions.
A message from Advisor Perspectives and VettaFi: Discover something new! Click here to register for our upcoming webcasts.
© Charles Schwab
Read more commentaries by Charles Schwab