Key takeaways
- Despite relatively flat, low-volatility headline indexes, market internals show widening dispersion, falling correlations, and broadening participation.
- Equal-weighted indexes, small caps, and international equities are outperforming cap-weighted benchmarks, echoing past periods when heavy Tech concentration constrained index-level gains and increased vulnerability beneath the surface.
- Iran-related geopolitical risk has boosted Energy leadership and volatility, while elevated stock- and sector-level swings reinforce the importance of diversification, rebalancing, and fundamentals-driven, active decision-making.
The tectonic plates of artificial intelligence (AI)—and more recently, the U.S./Israel war with Iran—are not simply shifting the prospects for markets and the economy. They are reshaping the fault lines of equity market leadership, with some of the most important trends occurring under the surface of the capitalization-weighted indexes.
Importantly, these shifts are not linear. We can't think of either the "AI trade" or the "Iran trade" as singular. They represent layered evolutions and are forcing faster reassessments of growth trajectories and the durability of leadership trends.
Resilience?
Even in the immediate aftermath of last weekend's news of the military strikes on Iran by the United States and Israel, the broad equity market continues to show signs of resilience. The market's internals tell a more complicated story, about which we've been writing for many months. Both the S&P 500 Equal Weight Index and Russell 2000 Index of small-cap stocks are handily outperforming the capitalization-weighted S&P 500, up +7% relative to 0.5% for the S&P 500. International stocks continue to outperform the S&P 500 this year: +7% and +13% for the MSCI EAFE (developed markets) and MSCI EM (emerging markets) indexes, respectively.
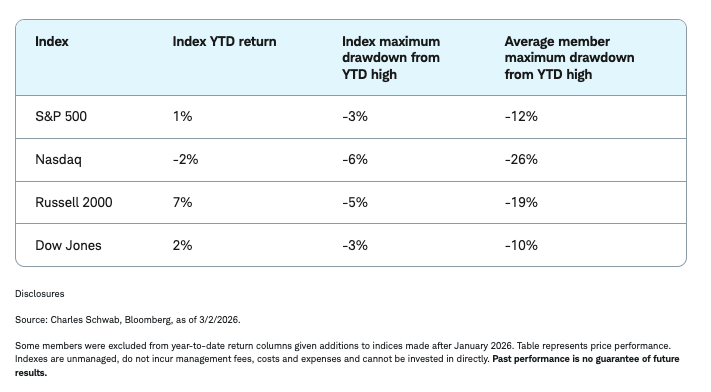
Shown below are several visuals that go on my (Liz Ann's) X feed every morning. The first looks at the four major equity indexes and a series of columns highlighting maximum drawdowns—both at the index and sub-index levels. At the index level, the S&P 500 is +1% year-to-date and the Nasdaq has a small -2% loss. As shown in the first table's third column, the S&P 500 and Nasdaq have only suffered mild maximum drawdowns year-to-date: -3% and -6%, respectively. More dramatic are the average member drawdowns: -12% for the S&P 500 and -26% for the Nasdaq year-to-date.
Average member maximum drawdowns have been deeper than at the index level
Major indexes and maximum drawdowns

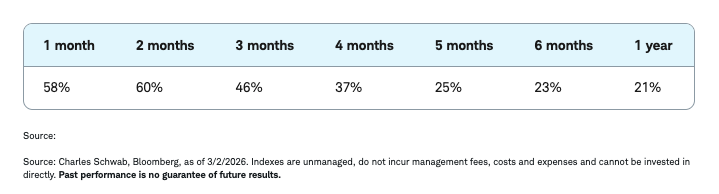
Next, we can look at the percentage of S&P 500 stocks outperforming the index itself over various rolling time periods. Only about 20% of the index's constituents have outperformed the index itself over the past year, but that has jumped to about 60% over the past couple of months. This broadening of participation suggests rotation rather than retreat. In other words, capital is moving within the market, not exiting it.
The percentage of S&P 500 constituents outperforming the index has broadened
% of S&P 500 members outperforming S&P 500 Index over the past year
At the same time, dispersion has increased, with a historically large percentage of stocks experiencing moves of at least plus or minus 20% so far this year. In other words, low index volatility has not translated into low stock-level volatility. Correlations have fallen and performance gaps have widened, creating a more selective environment in which stock picking matters more and passive concentration carries different risks than it did during the prior mega-cap tech-heavy leadership cycle.
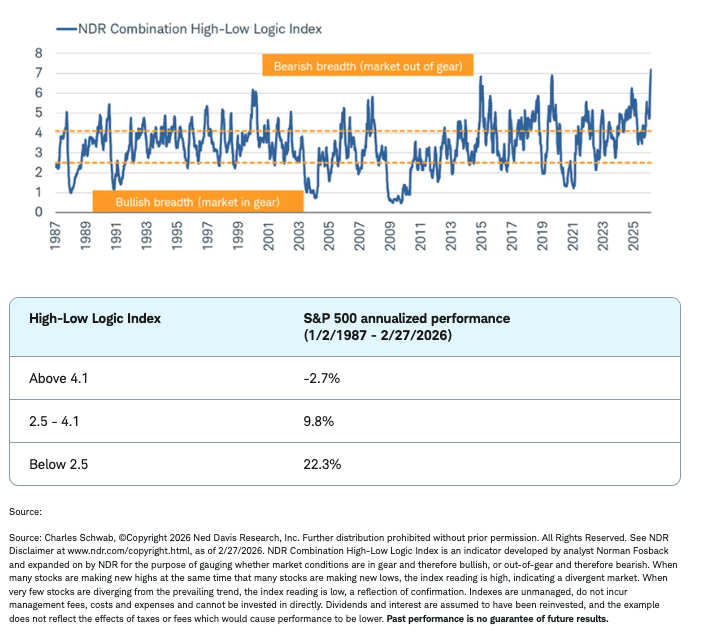
The NDR Combination High-Low Logic Index, shown below, reinforces this theme. Elevated readings indicate a market that is "out of gear," with meaningful numbers of stocks making new highs and new lows simultaneously. The original formula, created by Norm Fosback, focused on the New York Stock Exchange (NYSE) and applied a 10-week exponential moving average (EMA). NDR's version combines stocks that trade on the NYSE, AMEX, and Nasdaq, but still applies the 10-week EMA.
That kind of internal divergence does not necessarily signal imminent weakness, but it does reflect a lack of synchronized momentum beneath the surface. Historically, such conditions tend to precede either a pickup in volatility or a more decisive leadership handoff.
Market out of gear
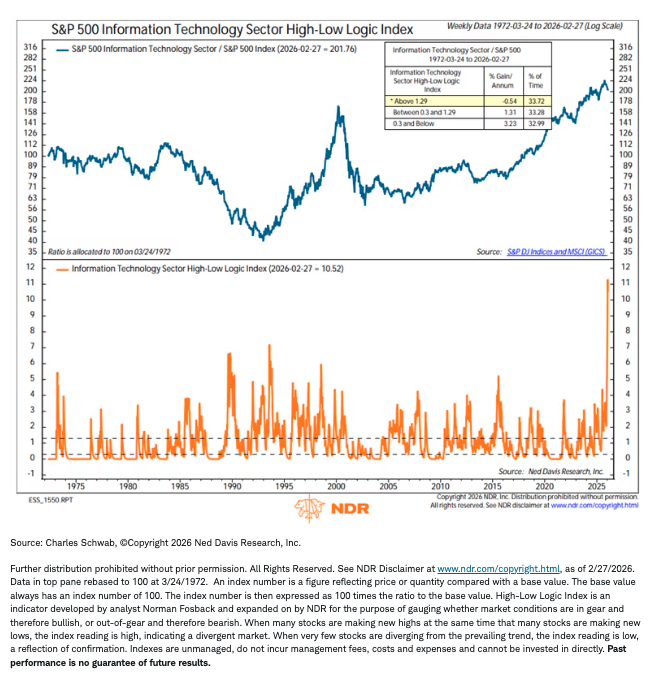
Even more extreme is the High-Low Logic Index for the S&P 500 Technology sector. The index went parabolic in the midst of the extreme selloff in the software stocks that accompanied the disruption caused by AI. Alongside the carnage in the software stocks was a surge in Tech industries like Hardware and Semiconductors. That spread has led to a recent record-high reading for this version of the High-Low Logic Index.
Tech sector way out of gear
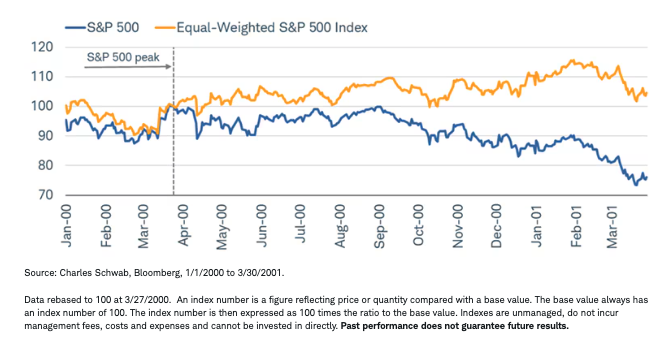
A focus on the Tech sector also warrants a comment on market concentration and a brief look back to the late 1990s, during which we saw many of the metrics discussed reach extreme levels—of course, due to the hype around the dot-com boom. Given the rotation at play today, with Tech taking a back seat and the rest of the market outperforming, it's worth keeping in mind that as that dynamic unfolded from 1999 to 2000, the equal-weighted S&P 500 outperformed the cap-weighted S&P 500 meaningfully. In fact, as you can see in the chart below, in the first year of the cap-weighted S&P 500's (blue line) bear market, the equal-weighted S&P 500 had a positive return. Of course, it eventually caught down, but for a solid year, it provided relative safety.
Tech's outsized influence
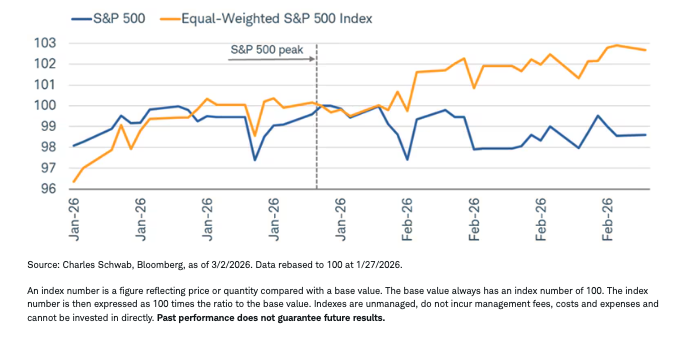
Of course, no two periods are the same and we don't mean this to come off as any kind of forecast or exact repeat of 2000. If anything, it's a reminder that given Tech's weight in the S&P 500, any persistent downward pressure for the sector can be powerful enough to halt the broader index's advance (we saw this as recently as 2022). Arguably, that has happened so far this year, with the cap-weighted S&P 500 only up slightly but the equal-weighted version already outperforming by a few percentage points.
Equal weight, not performance
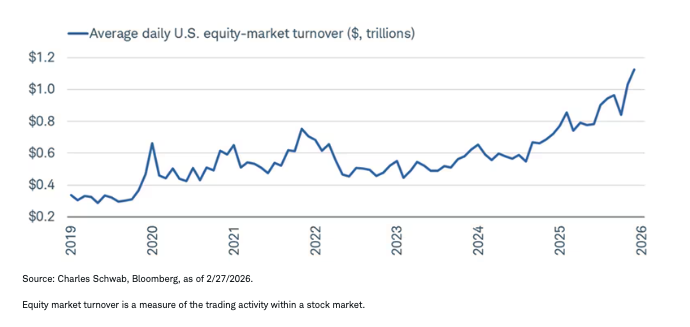
Zooming out
Despite a rocky start to the year, it's clear that investors haven't shied away from the market. As shown in the chart below, the average daily equity market turnover has hit a new cycle high, which is a function of elevated retail trader involvement.
Retail traders' influence
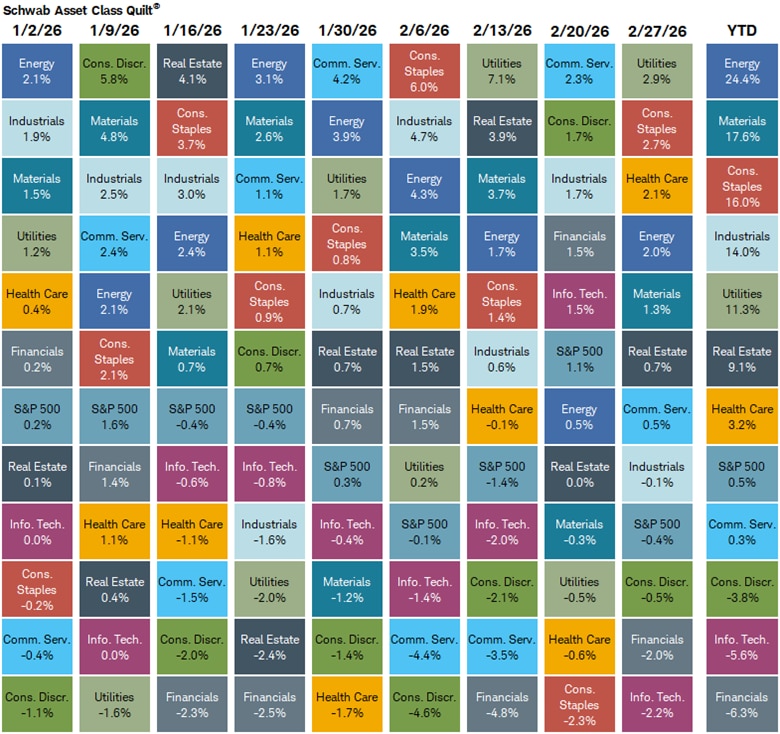
Sector performance so far this year underscores the leadership transitions, as shown below in our "sector quilt." Technology's dominance has softened over the past several months (contributing to the Nasdaq's relative underperformance). Meanwhile, broader participation—including by cyclicals and select defensives—has improved, while Energy has benefited from geopolitical crosscurrents/conflicts. The leadership baton is moving rather than disappearing.
Sector swingers
Notwithstanding Energy's leadership among sectors, sector volatility within the S&P 500 has been higher than usual. This volatility and higher dispersion/rotation reflect elevated single-stock and sector moves compared with recent years, even as the overall index has been deceptively calm. How do investors navigate this? Diversification and periodic rebalancing (managing position sizing) are key, but so is a focus on fundamentals and earnings trends. Shifts in earnings outlooks and economic drivers suggest a focus that's more on factor-based analysis than monolithic sector biases and can help identify sustainable potential winners (and help avoid overly reactive trades).
Implications
In light of the military conflict in/around Iran, trends in Energy's leadership are important for the broader market as well as the economy. Sustained high energy prices would contribute to an ongoing tightening of financial conditions. That would push up headline inflation, squeeze consumers and corporate margins, and complicate central bank policy. At the same time, ongoing geopolitical stress could trigger flights to perceived safety into Treasuries and/or the U.S. dollar, raising risk premiums and possibly weighing on equities. These channels are often how geopolitical risk is translated into tighter liquidity and more fragile market conditions.
This is not a market unraveling, nor is it one in full-throated risk-on mode. It is a market redistributing opportunity, easing concentration risk, and widening dispersion. The calm at the index level masks an active internal rotation that argues for discipline, diversification, selectivity, and a focus on breadth under the surface rather than just benchmark performance.
A message from Advisor Perspectives and VettaFi: Discover something new! Click here to register for our upcoming webcasts.
his material is intended for general informational and educational purposes only. This should not be considered an individualized recommendation or personalized investment advice. The investment strategies mentioned are not suitable for everyone. Each investor needs to review an investment strategy for his or her own particular situation before making any investment decisions.
All expressions of opinion are subject to change without notice in reaction to shifting market, economic or political conditions. Data contained herein from third party providers is obtained from what are considered reliable sources. However, its accuracy, completeness or reliability cannot be guaranteed.
Past performance is no guarantee of future results.
Investing involves risk, including loss of principal.
The policy analysis provided by the Charles Schwab & Co., Inc., does not constitute and should not be interpreted as an endorsement of any political party.
Performance may be affected by risks associated with non-diversification, including investments in specific countries or sectors. Additional risks may also include, but are not limited to, investments in foreign securities, especially emerging markets, real estate investment trusts (REITs), fixed income, municipal securities including state specific municipal securities, small capitalization securities and commodities. Each individual investor should consider these risks carefully before investing in a particular security or strategy.
All names and market data shown are for illustrative purposes only and are not a recommendation, offer to sell, or a solicitation of an offer to buy any security.
International investments involve additional risks, which include differences in financial accounting standards, currency fluctuations, geopolitical risk, foreign taxes and regulations, and the potential for illiquid markets.
Investing in emerging markets may accentuate this risk.
Diversification and asset allocation strategies do not ensure a profit and do not protect against losses in declining markets.
Rebalancing does not protect against losses or guarantee that an investor’s goal will be met. Rebalancing may cause investors to incur transaction costs and, when a non-retirement account is rebalanced, taxable events may be created that may affect your tax liability.
Currency trading is speculative, very volatile and not suitable for all investors.
Schwab does not recommend the use of technical analysis as a sole means of investment research.
Source: Bloomberg Index Services Limited. BLOOMBERG® is a trademark and service mark of Bloomberg Finance L.P. and its affiliates (collectively “Bloomberg”). Bloomberg or Bloomberg’s licensors own all proprietary rights in the Bloomberg Indices. Neither Bloomberg nor Bloomberg’s licensors approves or endorses this material or guarantees the accuracy or completeness of any information herein, or makes any warranty, express or implied, as to the results to be obtained therefrom and, to the maximum extent allowed by law, neither shall have any liability or responsibility for injury or damages arising in connection therewith.
Indexes are unmanaged, do not incur management fees, costs, and expenses, and cannot be invested in directly. For additional information, please see schwab.com/indexdefinitions.
Investment and Insurance Products Are: Not FDIC Insured • Not Insured by Any Federal Government Agency • Not a Deposit or Other Obligation of, or Guaranteed by, the Bank or any of its Affiliates • Subject to Investment Risks, Including Possible Loss of Principal Amount Invested
The Charles Schwab Corporation provides a full range of brokerage, banking and financial advisory services through its operating subsidiaries. Its broker-dealer subsidiary, Charles Schwab & Co. Inc. (Member SIPC), and its affiliates offer investment services and products. Its banking subsidiary, Charles Schwab Bank, SSB (member FDIC and an Equal Housing Lender), provides deposit and lending services and products.
This site is designed for U.S. residents. Non-U.S. residents are subject to country-specific restrictions. Learn more about our services for non-U.S. residents, Charles Schwab Hong Kong clients, Charles Schwab U.K. clients.
© 2026 Charles Schwab & Co., Inc. All rights reserved. Member SIPC. Unauthorized access is prohibited. Usage will be monitored.
© Charles Schwab
Read more commentaries by Charles Schwab