Wars. Pandemics. Terrorist attacks. Financial crises.
The U.S. stock market has seen all of these and more, and while events sometimes knock the market off its stride, it has always regained its footing, eventually marching to new highs.
History can be cold comfort to investors when they're watching their account balances fall and the news seems relentlessly gloomy.
But a look at the data—how markets reacted to past events and recovered—shows that disciplined investing means riding out volatility, because volatility is unavoidable if you want to stay in the market long enough to potentially generate positive returns.
We looked at 50 years of data—from 1975 through 2025—for the S&P 500Ò Index (SPX). Here's some of what we found:
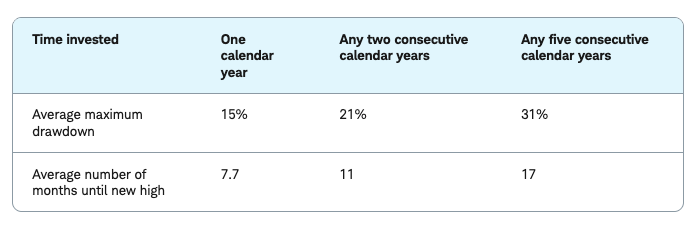
- The average maximum drawdown in a calendar year is about 15%. That means investors can expect a decline of roughly 15% from peak to trough in a typical year.
- The biggest drawdown reached or exceeded 20% in 14 of those years—nearly one of every three years. It exceeded 30% five times—about once every 10 years.
- Some drawdowns stretched across multiple calendar years. Looking at rolling two-calendar-year periods, we found that the biggest drawdown exceeded 20% in half of them.
- The maximum drawdown exceeded 30% in 21 of the 50 five-year rolling periods.
In other words, investors have seen a period of decline every year and in many cases a bear market. And there is a roughly one-in-10 chance that the drawdown in that single year will reach or exceed 30%. An investor holding on for any two calendar years has a 50% chance of experiencing a bear market (a decline of 20% or more from peak to trough).
But there's a flipside. When looking at maximum drawdowns within single calendar years, in about a third of the cases, the SPX had surpassed its previous high by the end of the following month. In 39 of those 50 drawdowns, a new high was reached within five months. Only seven times did it take a year or longer.

Stock markets and military conflicts
Wars can be especially unsettling due to the loss of life and the chaos they often unleash. Yet with any military conflict, it's also fair for investors to ask what it might mean for global stability, the economy, and the markets. When it comes to stock markets, history suggests an answer: Probably less than what was feared.
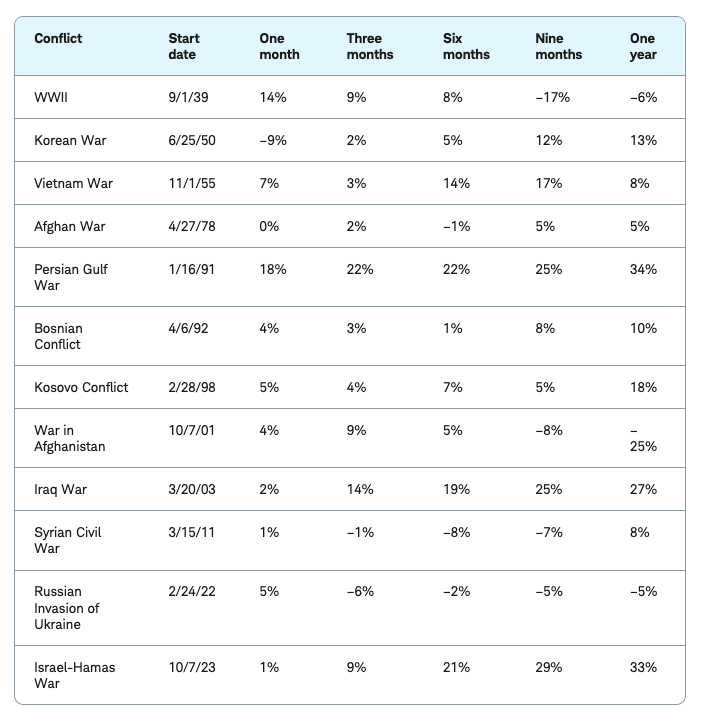
The Schwab Center for Financial Research (SCFR) looked at 12 military conflicts, from World War II through the Israel-Hamas war that began in 2023, and found that in nine of the 12 scenarios, the S&P 500 was higher a year after the conflict began.
The three exceptions were wars that started during periods of existing economic or market downturns. One was World War II, which began as the U.S. economy was struggling to escape the Great Depression. The war in Afghanistan started a month after 9/11, which happened when the SPX was already deep into a post-dot-com-bubble bear market. More recently, the 2022 Russian invasion of Ukraine started just as U.S. inflation was surging to multi-decade highs, prompting the Fed to launch its most aggressive rate-hike campaign in decades.
Another exception not among the 12 conflicts studied by SCFR: The 1973 Yom Kippur War, which triggered the Arab oil embargo and quadrupled the price of oil. The SPX fell about 43% in the 12 months following the start of the war on October 6, 1973.
Military conflicts and U.S. equities
The importance of staying invested
Many investors are tempted to get out of the market when there's trouble, thinking they'll jump back in when the market turns around. But it's extremely difficult to time the market successfully. And there's no need to try.
The average bear market for U.S. stocks has historically lasted a little more than a year, after which the market usually moves on to new highs. So individuals with all but the shortest investment horizons (two–three years or less) risk cutting into their future returns if they fail to catch the market's move higher.
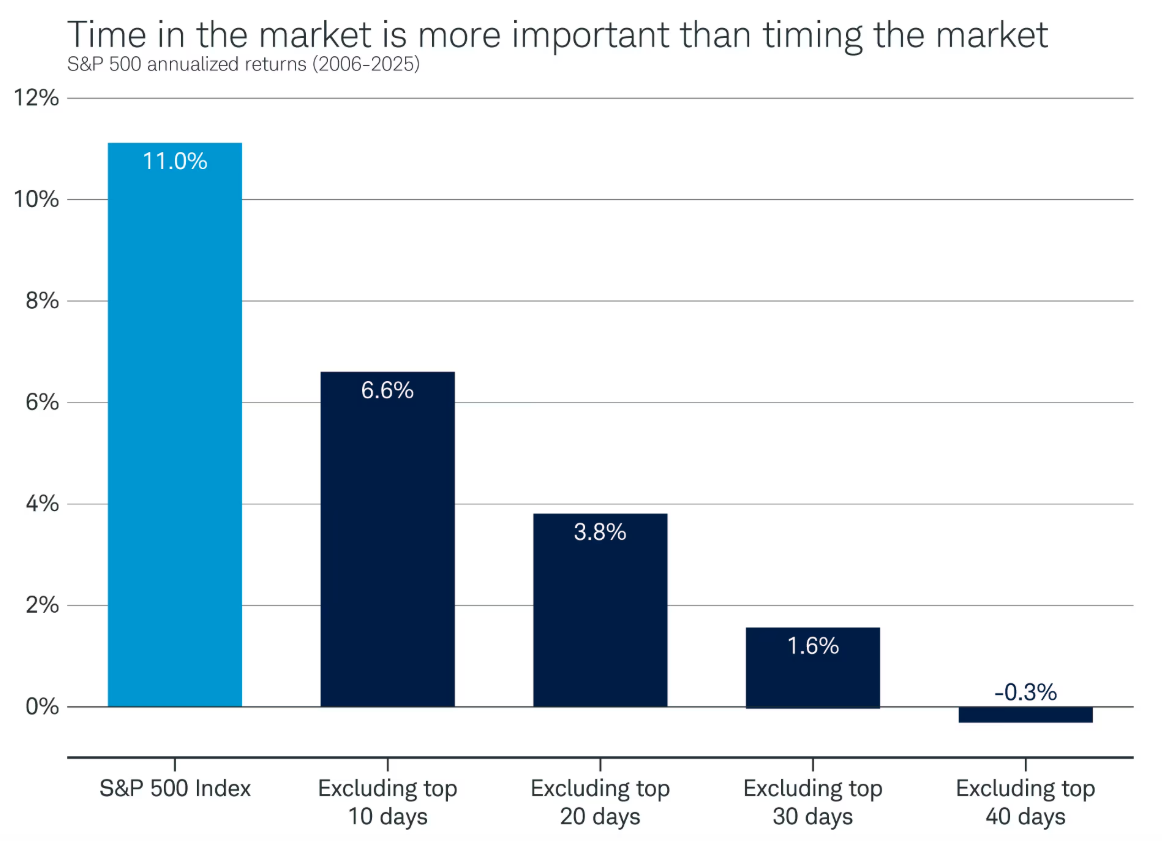
Consider the impact of missing just a few days of big gains. From 2006–2025, the SPX returned 11% annually. But exclude only the top 10 days across that 20-year period, and the annual returns drop to 6.6%. Miss the top 30 days, and they drop to 1.6%.
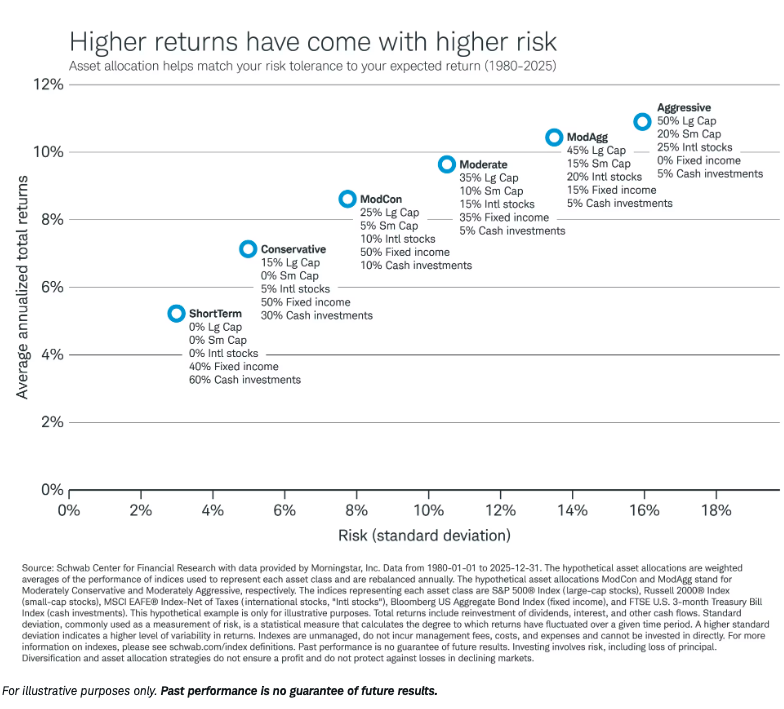
The importance of a balanced portfolio
Of paramount importance is setting appropriate goals for an investment portfolio. Goal-based investing is a crucial piece in developing the strategic asset allocation of a portfolio. Taking on too much risk relative to your time horizon or investment return needs can be counter-productive.
Maintaining a balanced portfolio can help limit volatility. A portfolio with a healthy mix of bonds will experience less volatility than those with stocks, according to SCFR research. A couple of examples:
- During the October 2007–February 2009 Great Recession, the maximum drawdown in the SPX reached 51%, while a portfolio that was 60% SPX stocks and 40% bonds (Bloomberg US Aggregate Bond Index) dropped a less-excruciating 31%.
- During the January–March 2020 COVID-19 sell-off, the SPX fell 20%, nearly double the 11% decline in the 60/40 portfolio.
Other keys to enduring volatility
- Stay focused on long-term goals. Historically, globally diversified portfolios of stocks and bonds have generated positive returns over the long term, despite various market events.
- Consider staying invested. It is extremely difficult to time the market successfully, and missing even a few top-performing days can significantly lower returns.
- Keep sufficient cash reserves. This will help investors avoid the temptation to sell volatile investments when the market is down.
A message from Advisor Perspectives and VettaFi: Discover something new! Click here to register for our upcoming webcasts.
Indexes are unmanaged, do not incur management fees, costs, and expenses (and/or "transaction fees or other related expenses"), and cannot be invested in directly. For more information on indexes, please see schwab.com/indexdefinitions and/or Schwab.com/IndexDefinitions. For additional information about the indices and terms shown, please visit www.schwabassetmanagement.com/resources/glossary.
This material is intended for general informational purposes only. This should not be considered an individualized recommendation or personalized investment advice. The investment strategies mentioned may not be suitable for everyone. Each investor needs to review an investment strategy for his or her own particular situation before making any investment decisions.
For illustrative purpose(s) only. Individual situations will vary. Not intended to be reflective of results you can expect to achieve.
All expressions of opinion are subject to change without notice in reaction to shifting market, economic or political conditions. Data contained herein from third party providers is obtained from what are considered reliable sources. However, its accuracy, completeness or reliability cannot be guaranteed.
Past performance is no guarantee of future results.
Investing involves risk, including loss of principal.
Supporting documentation for any claims or statistical information is available upon request.
The Schwab Center for Financial Research is a division of Charles Schwab & Co., Inc.
Investment and Insurance Products Are: Not FDIC Insured • Not Insured by Any Federal Government Agency • Not a Deposit or Other Obligation of, or Guaranteed by, the Bank or any of its Affiliates • Subject to Investment Risks, Including Possible Loss of Principal Amount Invested
The Charles Schwab Corporation provides a full range of brokerage, banking and financial advisory services through its operating subsidiaries. Its broker-dealer subsidiary, Charles Schwab & Co. Inc. (Member SIPC), and its affiliates offer investment services and products. Its banking subsidiary, Charles Schwab Bank, SSB (member FDIC and an Equal Housing Lender), provides deposit and lending services and products.
This site is designed for U.S. residents. Non-U.S. residents are subject to country-specific restrictions. Learn more about our services for non-U.S. residents, Charles Schwab Hong Kong clients, Charles Schwab U.K. clients.
© 2026 Charles Schwab & Co., Inc. All rights reserved. Member SIPC. Unauthorized access is prohibited. Usage will be monitored.
© Charles Schwab
Read more commentaries by Charles Schwab