Key takeaways:
- A persistent oil shock implies higher inflation and weaker growth, but risk assets appear unfazed, with equities and credit spread performance diverging from the caution implied by government bonds.
- Rates markets appear more consistent with historical precedents during oil supply shocks than risk assets, suggesting investors are still assigning significant probability to a less friendly near-term trade-off between growth and inflation risks.
- Higher starting yields have strengthened the case for high quality fixed income, with key metrics showing bonds offer relative appeal versus both cash and equities.
The Iran conflict has entered its third month, and markets have settled into a “two steps forward, one step back” rhythm. Since mid-April, oil prices have been grinding higher again: Spot West Texas Intermediate (WTI) is back to hovering around $105 a barrel, and the December WTI futures contract is only a hair below its early-April peak at around $82 a barrel as of this writing.
Read more: A Robot Economy: Who Gets Rich, Who Gets Left Behind
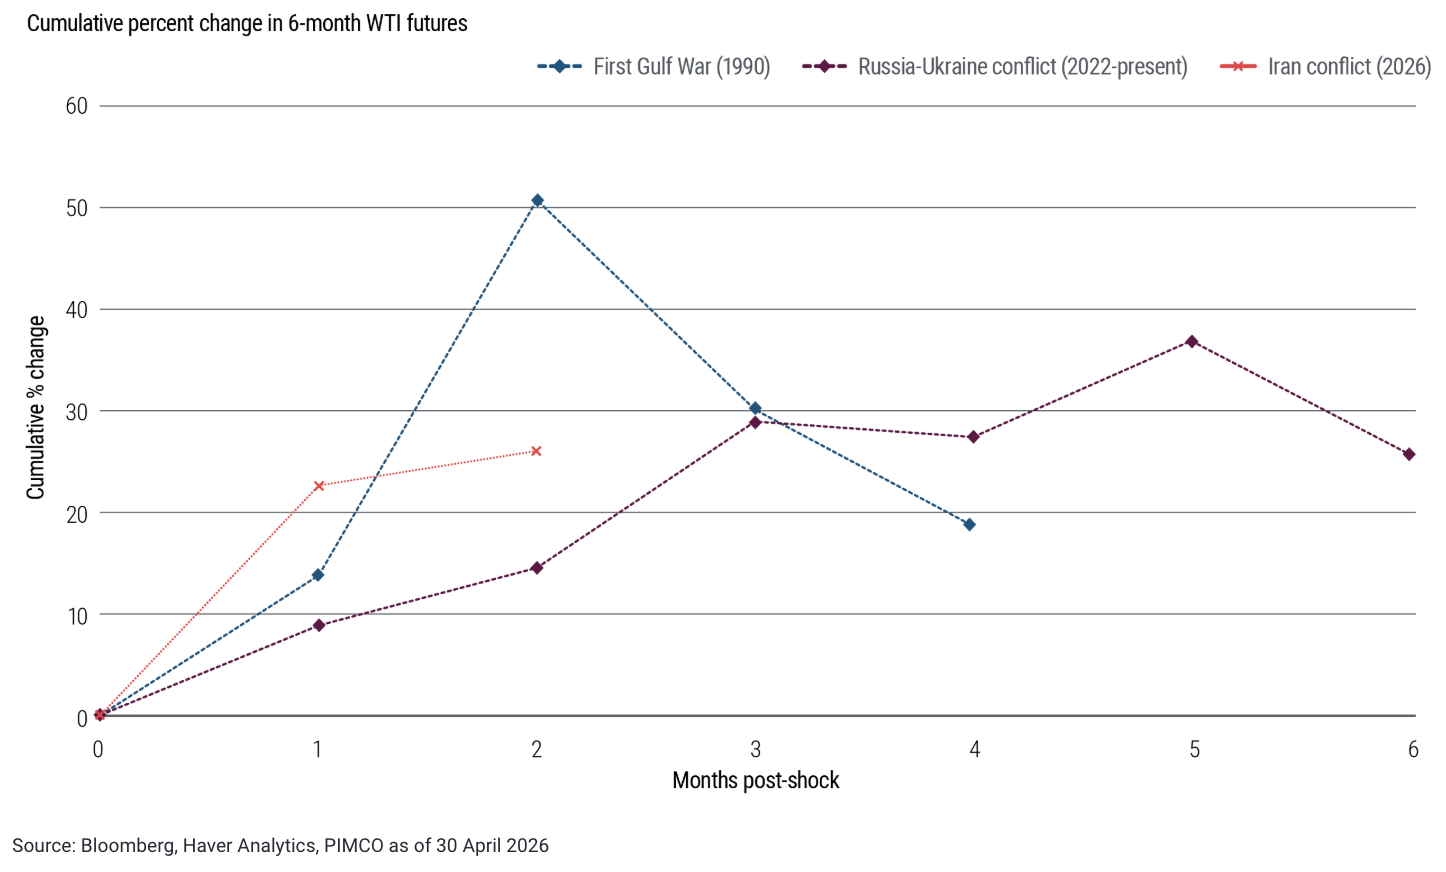
Figure 1 revisits cumulative changes in six-month crude futures across the three major oil supply shocks of the past four decades: the 1990 Gulf War, the 2022 Russia–Ukraine conflict, and the current Middle East war. Even after the relief rally following the U.S.–Iran ceasefire announcement, the current path for six-month futures, while less abrupt than in the immediate aftermath of the first Gulf War, has been more aggressive than the post-Russia-invasion trajectory in 2022.
Figure 1: The path for six-month futures has been higher than the trajectory in 2022

Despite the decidedly negative signal from the oil market, risk assets continue to shrug off the potential hit to activity from higher energy prices, leaning into the view that – absent a sharp oil spike and the associated need for demand destruction – the economy can likely muddle through. Rates markets, however, continue to price a more cautious distribution of outcomes: Much of the post-conflict premium remains visible in the front end and belly of the rates curve.
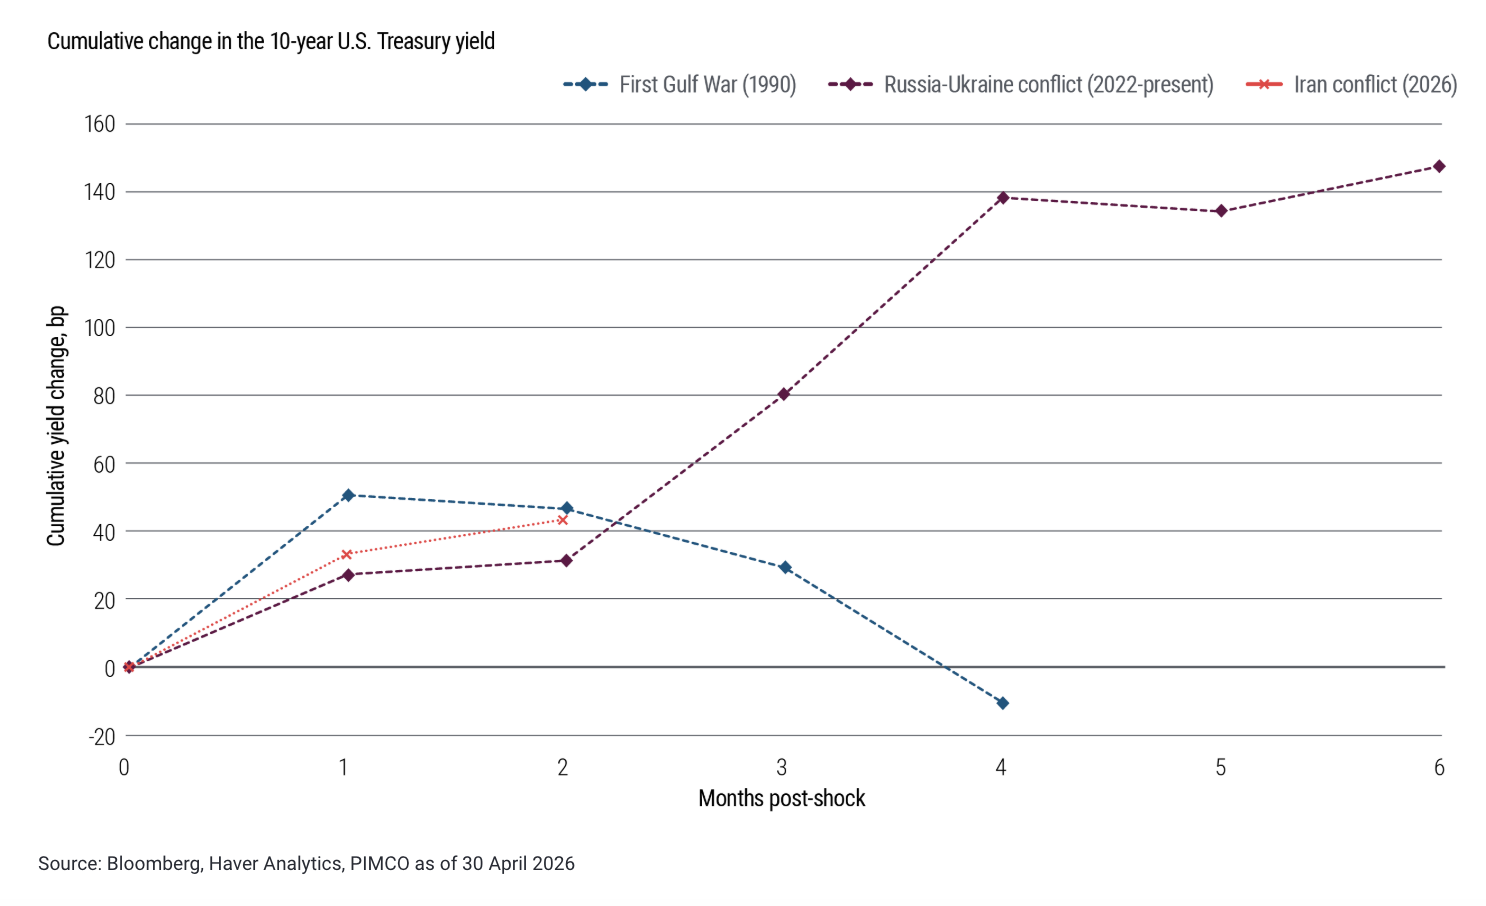
The cross-asset divergence is also unusual by historical standards. As shown in Figure 2, 10-year U.S. Treasury yields have followed a broadly similar pattern to those prior episodes. One important nuance, however, is that when the first Gulf War began, the U.S. Federal Reserve was already in the midst of an interest-rate-cutting cycle, which clearly supported the subsequent move lower in yields.
Figure 2: 10-year U.S. Treasury yields have followed a similar pattern to prior supply shocks …
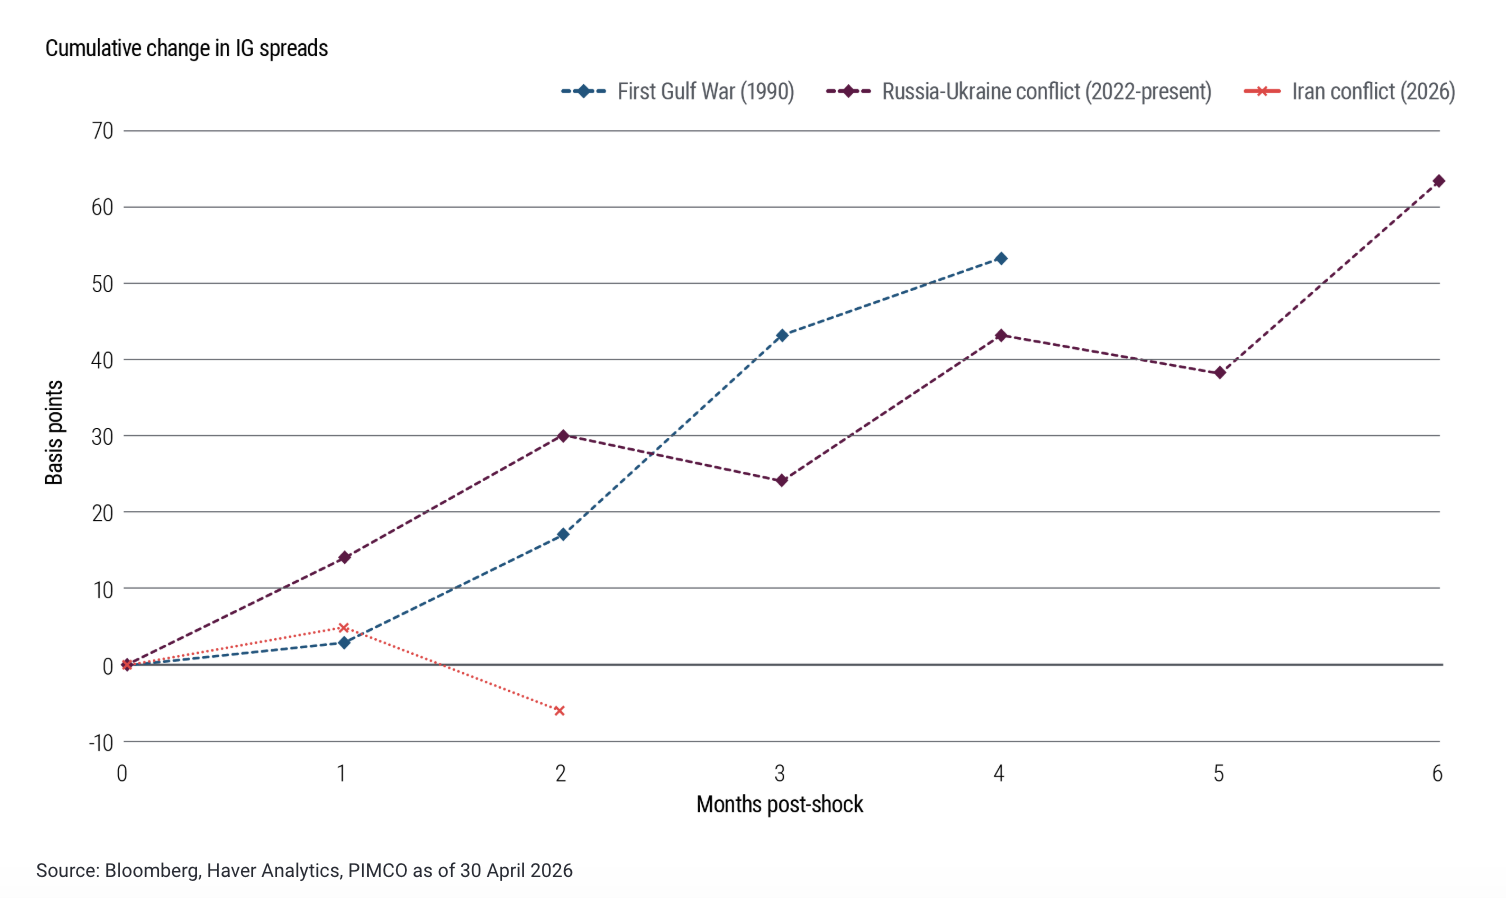
Risk assets, by contrast, have behaved very differently: The S&P 500 sits comfortably above its pre-conflict level, and both investment grade and high yield credit spreads are tighter than their pre-conflict levels (see Figure 3).
Figure 3: … But investment grade credit spreads, and more generally risk assets, have not
That divergence suggests markets are treating the most likely outcome as a mild stagflationary shock, enough to constrain central banks, but not enough to pose more serious long-term risks. Put another way, risk assets appear to be more willing to look through a period of potentially softer growth, higher inflation, and constrained monetary policy while rates can’t.
Markets are usually right in sniffing out inflection points, but not always; the key question is how the tail scenarios evolve around that baseline. One tail is an inflation re-acceleration that forces a materially more hawkish monetary policy response – a 2022-style “double whammy” of higher yields and weaker risk assets. The other is a negative growth shock: If higher oil prices persist, they could begin to choke activity, pulling both yields and risk assets lower.
For now, the balance of risks looks skewed toward the latter. Compared with 2022, today’s starting point is different: The labor market is more balanced, yields are higher, and aggregate demand is softer. (For details, read our latest Cyclical Outlook, “Layered Uncertainty: Conflict, Credit Stress, and AI.”)
Putting the current yield support in context
While yields are at the high end of their recent range, they remain below their 2023–2024 highs – an observation sometimes used to argue that high quality public fixed income is less attractive today. That comparison is misleading because policy rates have moved lower since then.
A more relevant lens is relative value versus cash and versus equities, and what that implies for the role of bonds in a multi-asset portfolio. On both fronts, the case for fixed income looks stronger today.
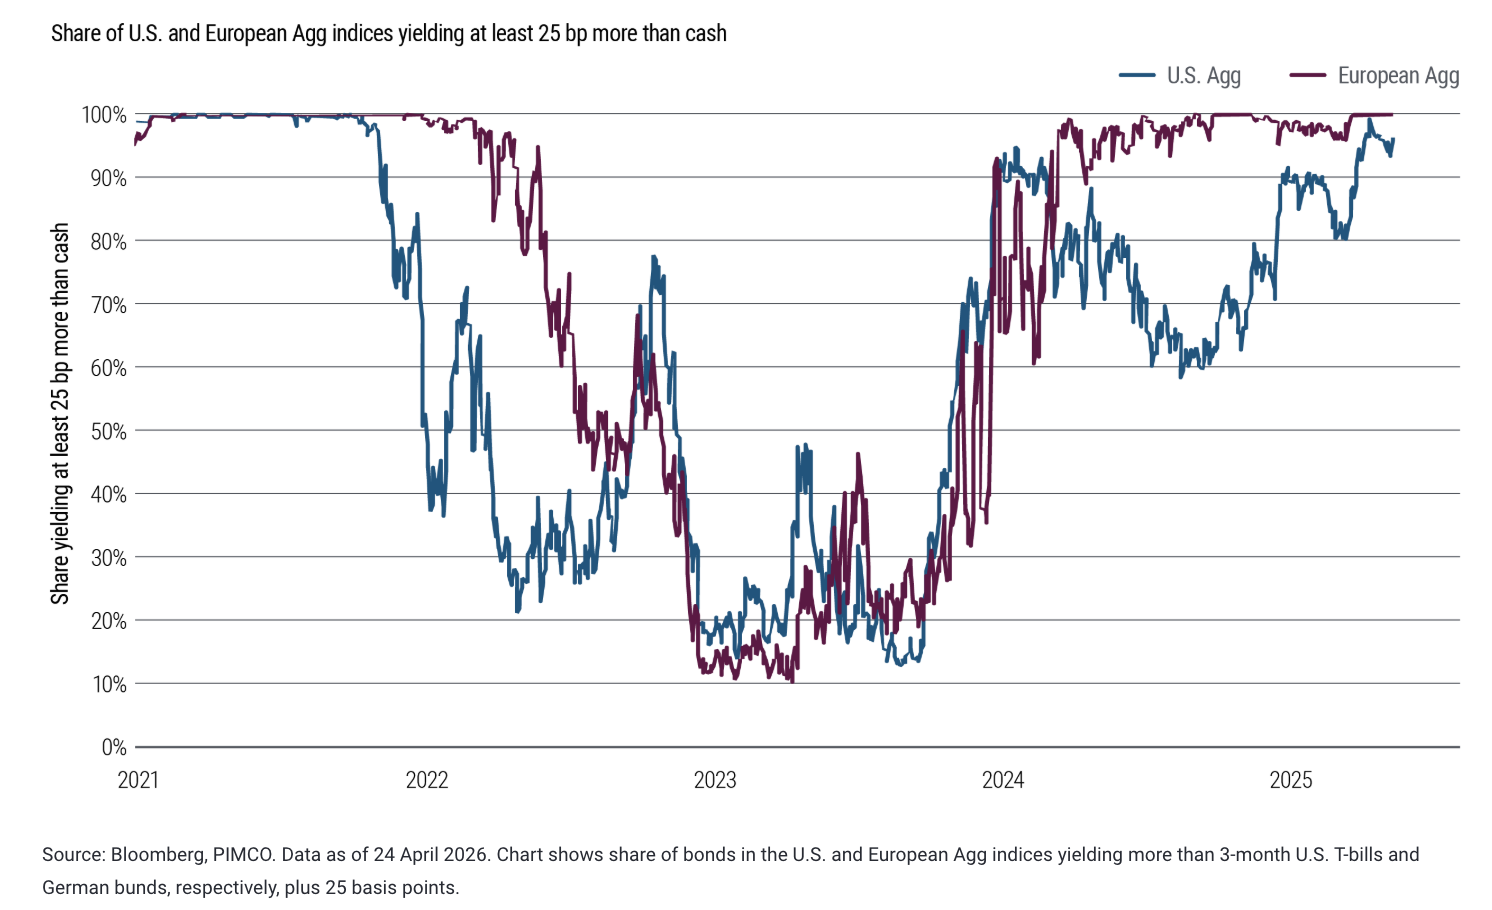
Against cash, the shift is particularly notable. The share of bonds in the U.S. and Europe that yield at least 25 basis points (bps) more than cash is now close to 100% – a sharp improvement from 2023, when roughly 80% of the Bloomberg U.S. Aggregate (Agg) Index yielded less than cash plus 25 bps (see Figure 4).
Figure 4: In both U.S. dollar and euro markets, cash scores poorly versus bonds
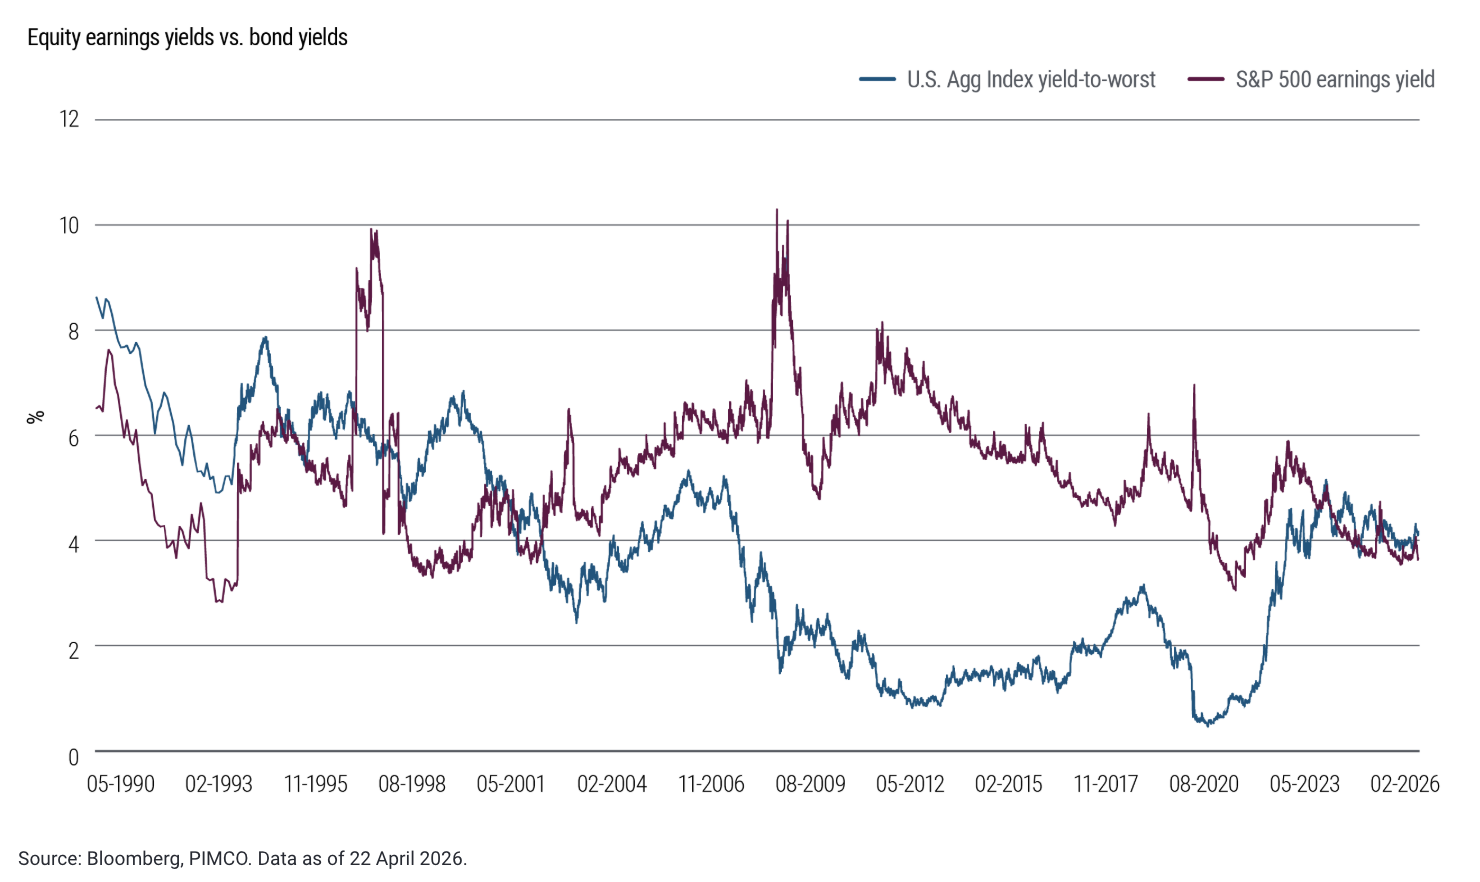
The comparison versus equities is similarly compelling: The yield on the U.S. Agg Index continues to exceed the earnings yield of the S&P 500, a crossover not seen since the early 2000s (see Figure 5).
Figure 5: The U.S. Agg Index yield exceeds the earnings yield of the S&P 500
Stepping back, this reset in yields versus cash also improves the value proposition of bonds in a multi-asset portfolio, particularly because the trade-off between upside inflation surprises and downside growth surprises appears more balanced today than it did in 2023.
Michael Puempel and Gabriel Cazaubieilh contributed to this report.
A message from Advisor Perspectives and VettaFi: Discover something new! Click here to register for our upcoming webcasts.
Statements concerning financial market trends or portfolio strategies are based on current market conditions, which will fluctuate. There is no guarantee that these investment strategies will work under all market conditions or are appropriate for all investors and each investor should evaluate their ability to invest for the long term, especially during periods of downturn in the market. Outlook and strategies are subject to change without notice.
Charts are provided for illustrative purposes and are not indicative of the past or future performance of any PIMCO product. Forecasts, estimates and certain information contained herein are based upon proprietary research and should not be considered as investment advice or a recommendation of any particular security, strategy or investment product. It is not possible to invest directly in an unmanaged index.
Past performance is not a guarantee or a reliable indicator of future results. All Investments contain risk and may lose value. Investing in the bond market is subject to risks, including market, interest rate, issuer, credit, inflation risk, and liquidity risk. Equities may decline in value due to both real and perceived general market, economic and industry conditions. Sovereign securities are generally backed by the issuing government. Investing in foreign-denominated and/or -domiciled securities may involve heightened risk due to currency fluctuations, and economic and political risks, which may be enhanced in emerging markets. Derivatives may involve certain costs and risks, such as liquidity, interest rate, market, credit, management and the risk that a position could not be closed when most advantageous. Investing in derivatives could lose more than the amount invested.
PIMCO as a general matter provides services to qualified institutions, financial intermediaries and institutional investors. Individual investors should contact their own financial professional to determine the most appropriate investment options for their financial situation. This material contains the opinions of the author and such opinions are subject to change without notice. This material has been distributed for informational purposes only and should not be considered as investment advice or a recommendation of any particular security, strategy or investment product. Information contained herein has been obtained from sources believed to be reliable, but not guaranteed. No part of this material may be reproduced in any form, or referred to in any other publication, without express written permission. PIMCO is a trademark of Allianz Asset Management of America LLC in the United States and throughout the world.
© PIMCO
Read more commentaries by PIMCO