(More) Roses Amid Garbage and Trap Doors
Membership required
Membership is now required to use this feature. To learn more:
View Membership BenefitsWe know that conditions that join extreme valuations with unfavorable internals – particularly with lopsided bullish sentiment – have generally been followed by very poor market returns, on average. I’ve often referred to these as ‘trap door’ conditions. But looking at our 2024 hedging implementation, I asked – what if we extend that implementation a bit further to see if we can cultivate roses even there? Not only opportunities to vary the intensity of our downside hedges, but opportunities to adopt a constructive stance, albeit with a safety net, even in conditions that we’ve labeled as bearish ‘garbage.’
Strikingly, just over two percent of market conditions across history are roses – blooming amid garbage – often surrounded by the most speculative and seemingly dangerous conditions. Not surprisingly, they bloom from patches of soil that are already ‘indeterminate’ – periods when our September 2024 implementation already reduces the intensity of our downside hedges. The consistency of market gains in these periods provides a clear benefit in reversing the hedge from mildly bearish to ‘constructive with a safety net’ – removing the ‘upside cap’ on potential returns, while setting a safety net at modestly lower level. There’s still risk, of course, but that’s why the safety net is there.
Because ‘trap door’ conditions have been more frequent in recent years, these ‘roses’ appear in close to 15% of weekly periods during most recent 1-, 3-, and 5-year horizons. Yet they easily account for more than half of the S&P 500 total return over these horizons. As an example – in certain conditions that one would otherwise classify as quite risky, there can be selloffs amid very high levels of bullish sentiment and low bearish sentiment; where the lopsided bullish sentiment acts not as a negative ‘contrary’ indicator, but as a signal that speculators simply can’t shake their optimism. These selloffs are followed by ‘fast, furious, prone-to-failure’ rallies with striking regularity.
– John P. Hussman, Ph.D., How I Learned to Love the Bubble (Before it Bursts), February 2026
Amid record stock market extremes and the understandable and nearly frantic fear of missing out on the spectacular now, I thought it would be helpful to publish the May comment early. Investors may be feeling some distress. What to do? Does one capitulate and chase the bubble at the highest valuations in history? Does one wring their hands at the prospect of a bubble that might only go higher and higher forever without end? My hope is that this month’s comment will offer both perspective and confidence that it is not necessary to chase current extremes, nor to be anxious even about the possibility of steeper ones.
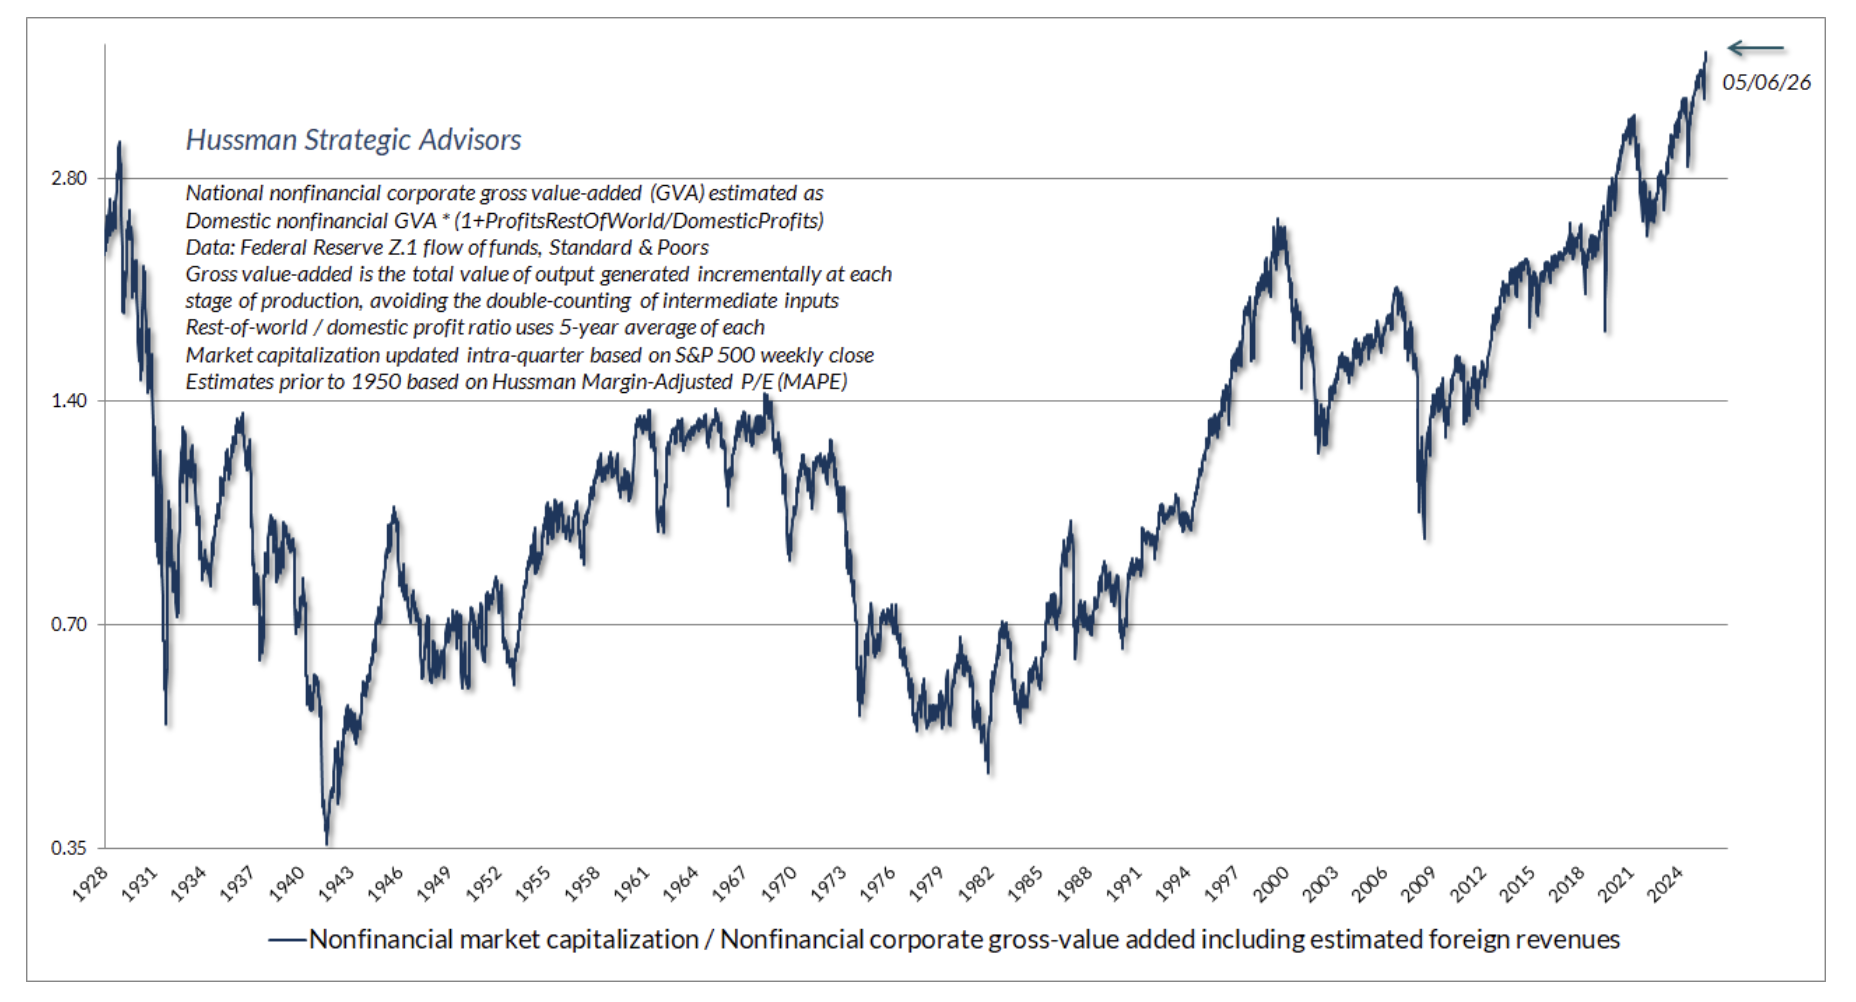
First, let’s take a moment to gasp in wonder at the current extremes in the equity market. The chart below shows our most reliable valuation measure, based on its correlation with actual subsequent market returns across a century of market cycles. The chart shows the ratio of nonfinancial market capitalization to gross value-added (MarketCap/GVA). Gross value-added is the sum of corporate revenues generated incrementally at each stage of production, so MarketCap/GVA might be reasonably be viewed as an economy-wide, apples-to-apples price/revenue multiple for U.S. nonfinancial corporations.
Read more: The Case for Acting Now in International Deep Value
There’s no question that the profit margin expansion of recent years partly accounts for the extremes we see in revenue-based valuation measures. But as we’ve observed in numerous previous comments, elevated corporate margins are the mirror image of record deficits among households and government – it’s an accounting identity. Assuming the permanence of one assumes the permanence of another. Meanwhile, even earnings-based valuations rival those of 1929 and 2000. To see the breathtakingly aggressive and optimistic earnings projections now baked into the cake of forward price/earnings multiples, see Bill Hester’s recent research article, Extreme Earnings Forecasts Mask Stock Market Risk.
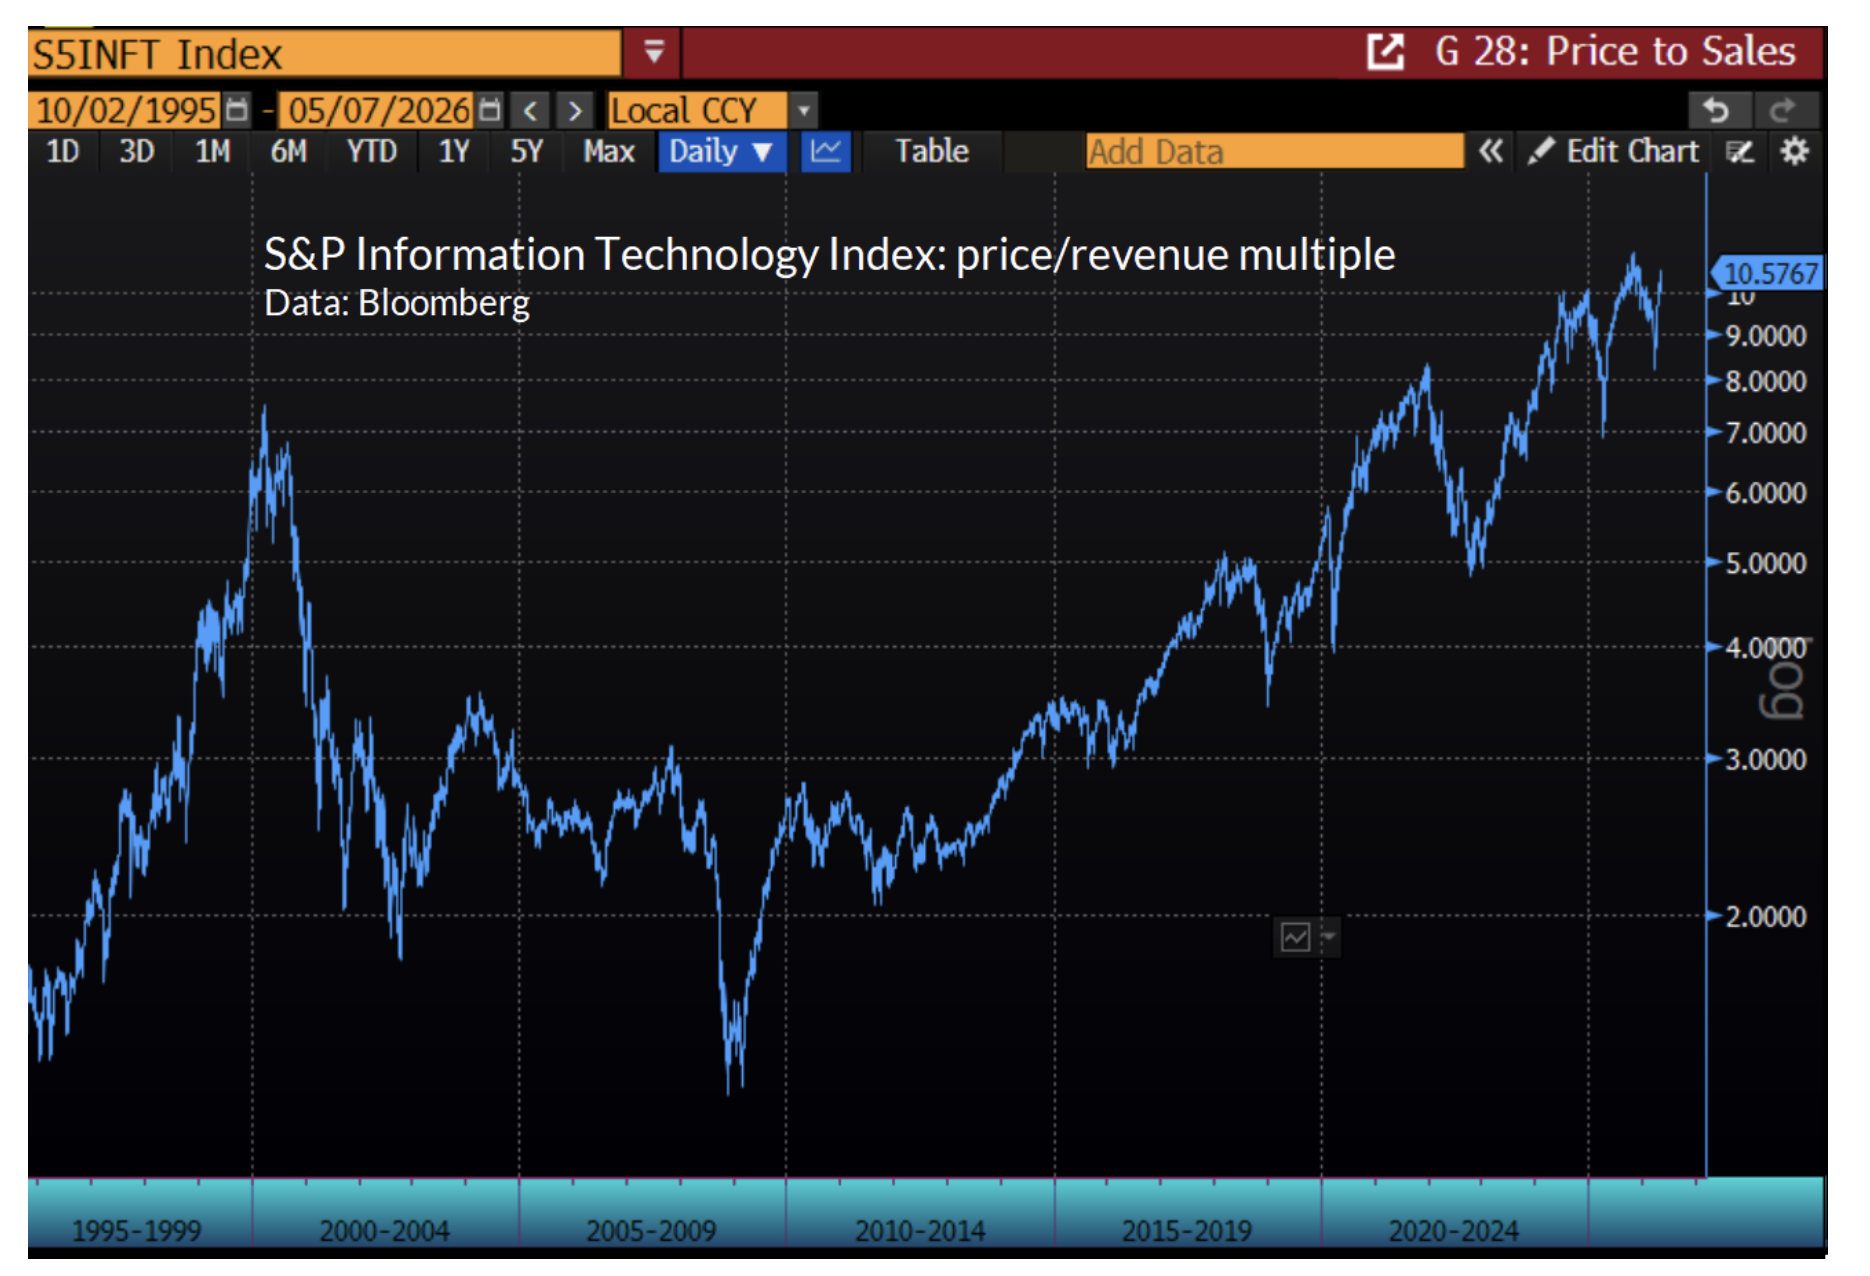
We see another version of these extreme valuations in the price/revenue multiple of the information technology sector.
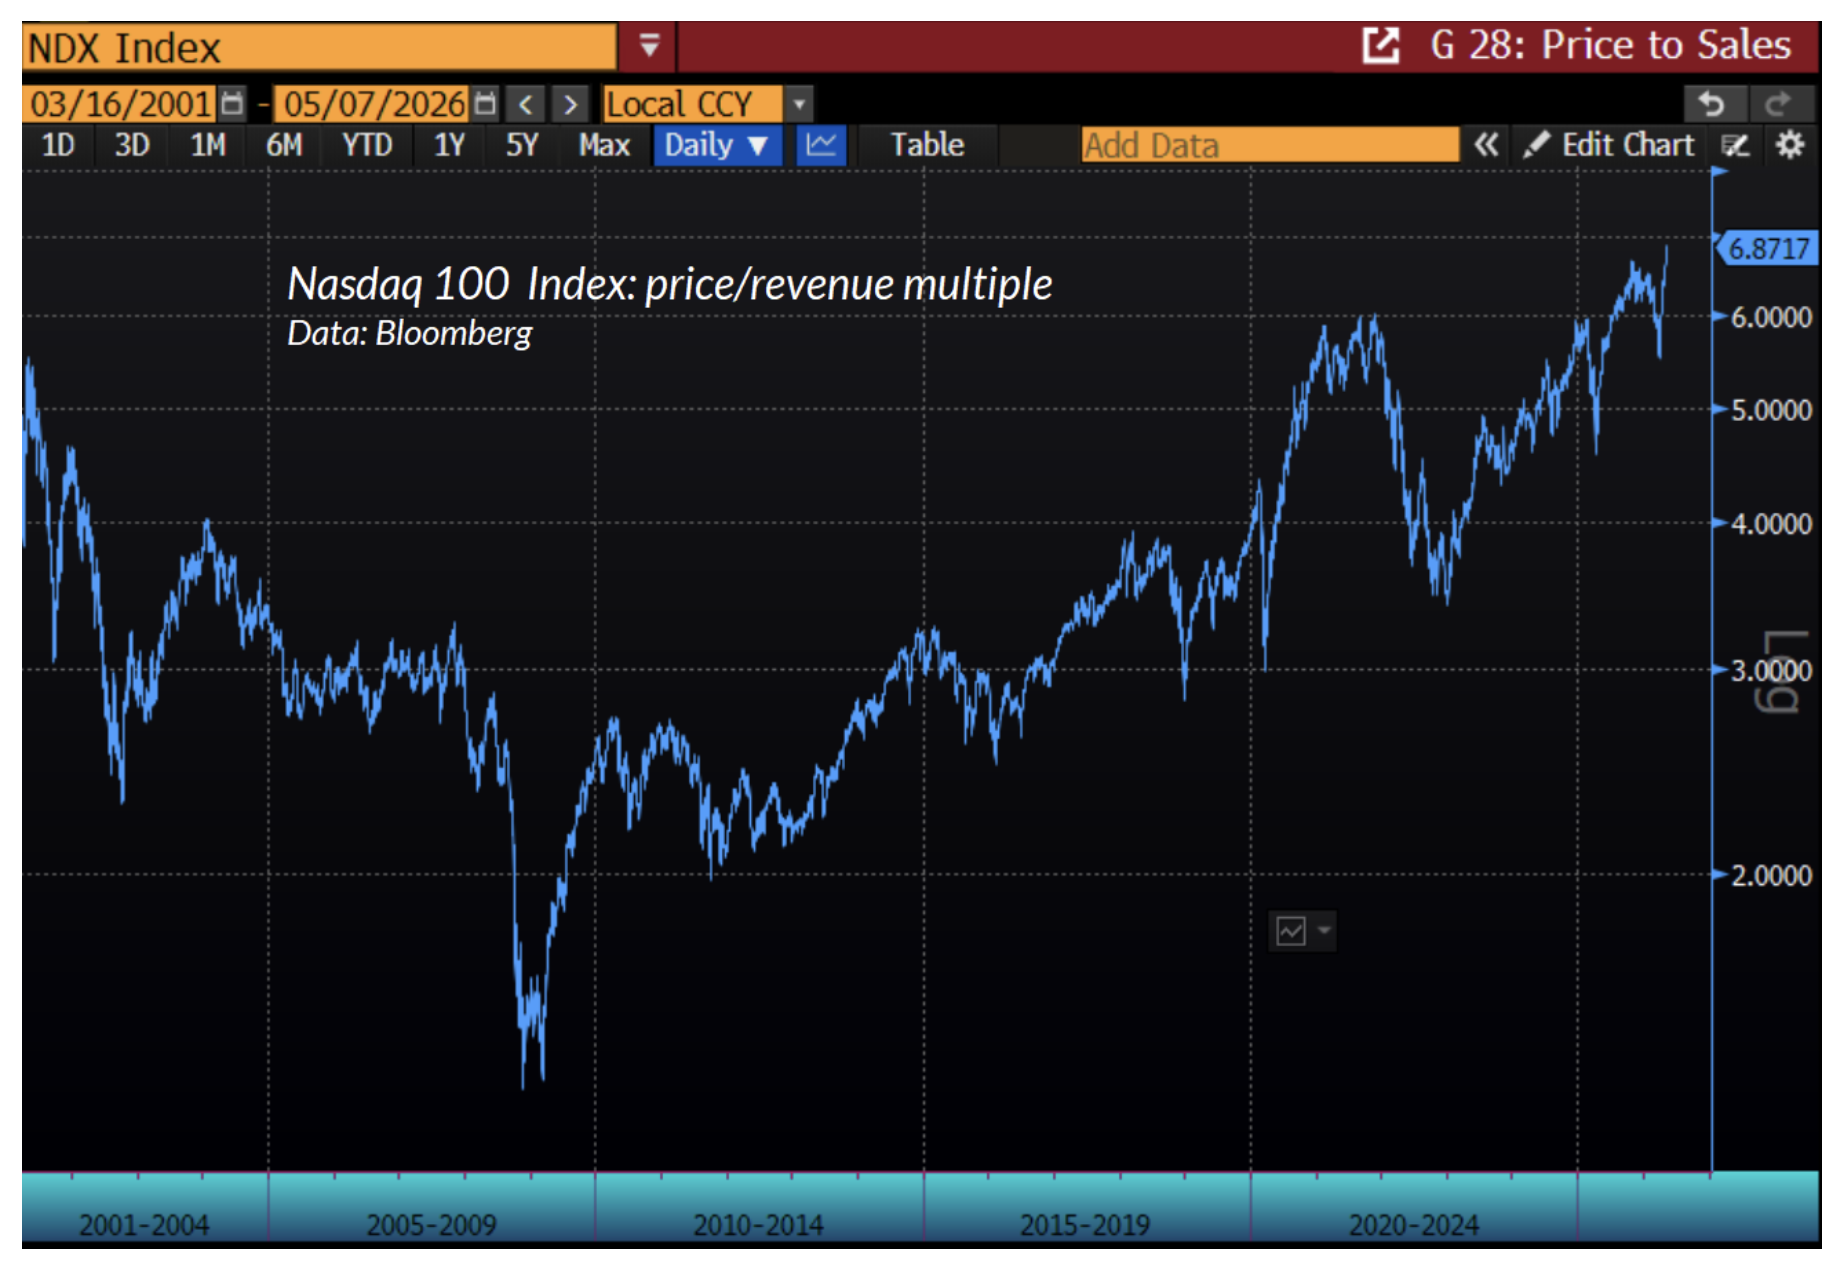
The exuberance of the spectacular now is also evident in the steep valuation of the Nasdaq 100.
I’ve noted before that while valuation multiples can be quite high at the beginning of a period of rapid earnings and revenue growth, valuations should also progressively decline as that rapid growth is realized. This has not happened in recent years, and the historical consequences of that tend to be regrettable. As I observed in March:
How do we know this trajectory isn’t just rational valuation at work? Well, one of the red flags is that, for the largest technology stocks, valuation multiples haven’t declined as enormous growth in fundamentals has proceeded. Despite profound revenue growth since 2000, many of the behemoths currently have price/revenue multiples close to or higher than the multiples they had in the late-1990’s.
If valuations aren’t falling, one of two things (or both) must be occurring from a present-value perspective. Either there has been a significant decline in the long-term rate of return investors can expect, or investors are repeatedly shifting the entire trajectory of future growth higher – treating each period as a new starting point, but pushing the same high expected growth rate further and further into the future.
In my view, both of these are occurring. Specifically, valuations for the largest information technology companies are at levels that only make sense if one discounts optimistic future cash flows at depressed long-term rates of return. Meanwhile, these valuations suggest that the expected returns in the heads of investors are tethered to the current earnings and revenue growth rates of the companies themselves, as if these growth rates are permanent.
John P. Hussman, Ph.D., Equilibrium and the Dentist in Poughkeepsie, March 2026
(More) roses amid garbage and trap doors
I’ve regularly expressed my enthusiasm about the hedging implementation we introduced in September 2024 – which has avoided a lot of discomfort – allowing us to end up essentially flat since then, despite having a bearish investment outlook in a market advance that now stands at the most extreme valuations in U.S. financial history. As I’ll discuss more at the end of this comment, even a flat return with negative market correlation can raise the return/risk profile of a portfolio invested between a market index and an alternative investment strategy. Clearly our objectives go far beyond that, but the September 2024 implementation has certainly been helpful.
Still, that implementation was not enough, in two ways. It allowed us to vary the intensity of our bearish investment stances even during periods of solidly extreme valuations and unfavorable market internals, but it took until February of this year to arrive at an acceptable way to periodically and regularly shift to a constructive outlook during these periods. Second, while our stock selection discipline has cleanly outperformed the S&P 500 across decades of market cycles, we remained vulnerable to brief but unpleasant periods – like the past month – where a handful of speculative stocks becomes a world to itself.
On both fronts, what was missing from our September 2024 hedging implementation was a historically reliable and risk-managed way to achieve “upside capture” in the event of an ever-expanding bubble. We resolved that in February – I do hope you’ll re-read that section on “Roses and garbage” because the underlying insight applies to so much more than investing alone. As I wrote then, and reprinted as the opening quote of this comment:
“Not surprisingly, they bloom from patches of soil that are already ‘indeterminate’ – periods when our September 2024 implementation already reduces the intensity of our downside hedges. As an example – in certain conditions that one would otherwise classify as quite risky, there can be selloffs amid very high levels of bullish sentiment and low bearish sentiment; where the lopsided bullish sentiment acts not as a negative ‘contrary’ indicator, but as a signal that speculators simply can’t shake their optimism. These selloffs are followed by ‘fast, furious, prone-to-failure’ rallies with striking regularity.”
Although we saw a brief market selloff of about 9% from late-January to late-March, it was accompanied by too much bearish sentiment to make a constructive shift reliable – similar levels of bearishness have historically been followed by very mixed returns. Investor sentiment is helpful mainly because it’s an observable measure of “stubborn optimism.”
Among other proxies for “stubborn optimism”, our very best measure of investor psychology is our gauge of market internals. That’s been persistently divergent since just before the 2022-2023 market retreat. Observe, for example, that since the interim market peak on January 4, 2022, the “Magnificent 7” have gained 144%, while the S&P 500 equal-weighted index has gained just 35%. Still, there are multiple factors that “feed into” that gauge of internals – maybe a bit less than perfect was enough. Studying these factors as an alternative proxy for “stubborn optimism” has been the main focus of my research in recent weeks. The uniformity of those sub-components turns out to be enough to identify an additional yet similarly reliable set of “roses amid garbage” across history – including a modest one during February and a very nice one in March of this year.
Taken together, our discipline classifies about 64% of historical periods as constructive or strongly bullish, including 40% of periods over the past decade. What’s more important is that, even given the investment environment since 2021, featuring persistently unfavorable internals and persistently extreme valuations, our measures allow us to classify fully 19% of this period as constructive – albeit with a safety net. Moreover, this 19% subset of periods since 2021 comprises the entire cumulative gain in both the S&P 500 and the Nasdaq 100 over the full period. We find that the same criteria are useful across history.
As I noted in February, “loving the bubble” doesn’t mean taking risks that rely on the bubble to be permanent, or that assume it won’t immediately collapse. Instead, it means finding more flexibility in our outlook, ideally with a safety net in periods we’re able to be constructive. We can now apply that flexibility to a larger set of constructive instances. Now is still not one of them.
It may help to discuss where these “roses” tend to emerge. We know that even in markets where investors are highly risk-averse, sufficient “compression” in the market is often enough to provoke what call clearing rallies – “fast, furious, prone-to-failure” advances that serve to clear the oversold conditions.
Well, suppose instead that you have an investment environment where investors are stubbornly optimistic – with some measurable inclination to chase risk. In these environments, short-term weakness is met with an almost reflexive “buy the dip” mentality. Investors may not realize that the success of that strategy isn’t an inherent feature of the market – it relies on the stubborn optimism in their own heads – but if measurable optimism is there, based on sentiment or components that “feed into” our gauge of market internals, and we’re careful to maintain a safety net, these selloffs can indeed provide regular windows of constructive opportunity.
Taken together, our discipline classifies about 64% of historical periods as constructive or strongly bullish, including 40% of periods over the past decade. What’s more important is that, even given the investment environment since 2021, featuring persistently unfavorable internals and persistently extreme valuations, our measures allow us to classify fully 19% of this period as constructive – albeit with a safety net. Moreover, this 19% subset of periods since 2021 comprises the entire cumulative gain in both the S&P 500 and the Nasdaq 100 over the full period. We find that the same criteria are useful across history.
The green line in the chart below shows the cumulative total return of the S&P 500 during periods since 2021 – all amid unfavorable internals and extreme valuations – that our present discipline identifies as “constructive.” The reason the profile looks like a stairstep is partly the reliability of these “roses,” and partly because they’re briefly constructive – typically following short-term market retreats – then they get out of Dodge until the next one emerges. You’ll note that we’ve seen no roses in the past few weeks, but that’s another way of saying that we don’t need to chase this rally. We can be patient for the next set of constructive conditions to emerge. Meanwhile, we can reasonably expect that there will be ample points in the future for “upside capture” – even if the bubble never bursts.
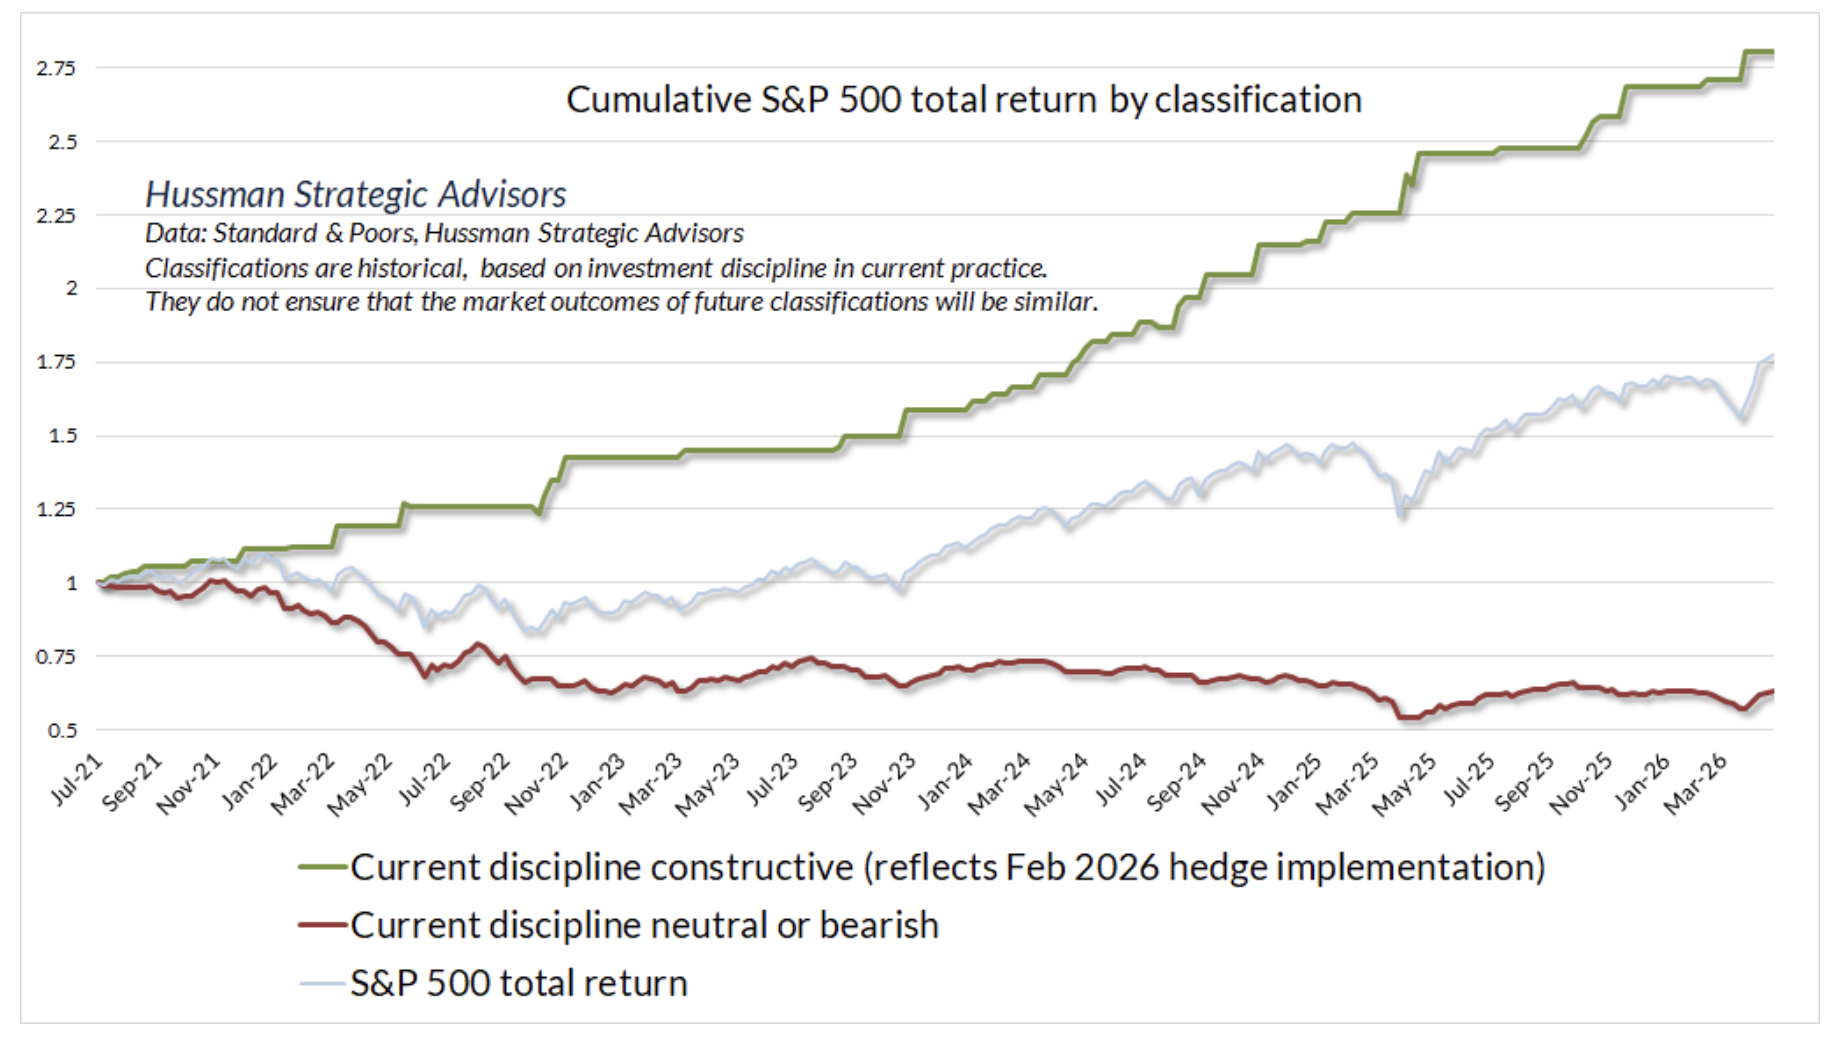
To be clear, yes, despite the market advance in recent weeks, our investment discipline even as it stands today has classified the market outlook as constructive in only a single week of February and a single week of March during 2026. Those two weeks comprise a 4.5% gain in the S&P 500, while the S&P 500 is up 7.6% year-to-date. Market outcomes will always be uncertain, and it’s quite possible that future roses will come with thorns.
One might imagine a more precise and aggressive world where one could have hidden in a bunker until March 30 and somehow captured the full S&P 500 advance of over 15% since then. We don’t imagine that world, because we doubt it exists. We focus on one where we can respond systematically to observable conditions. It’s far more than enough for us that so many roses could exist amid market conditions that a century of history taught us were garbage.
As I noted in February, “loving the bubble” doesn’t mean taking risks that rely on the bubble to be permanent, or that assume it won’t immediately collapse. Instead, it means finding more flexibility in our outlook, ideally with a safety net in periods we’re able to be constructive. We can now apply that flexibility to a larger set of constructive instances. Now is still not one of them.
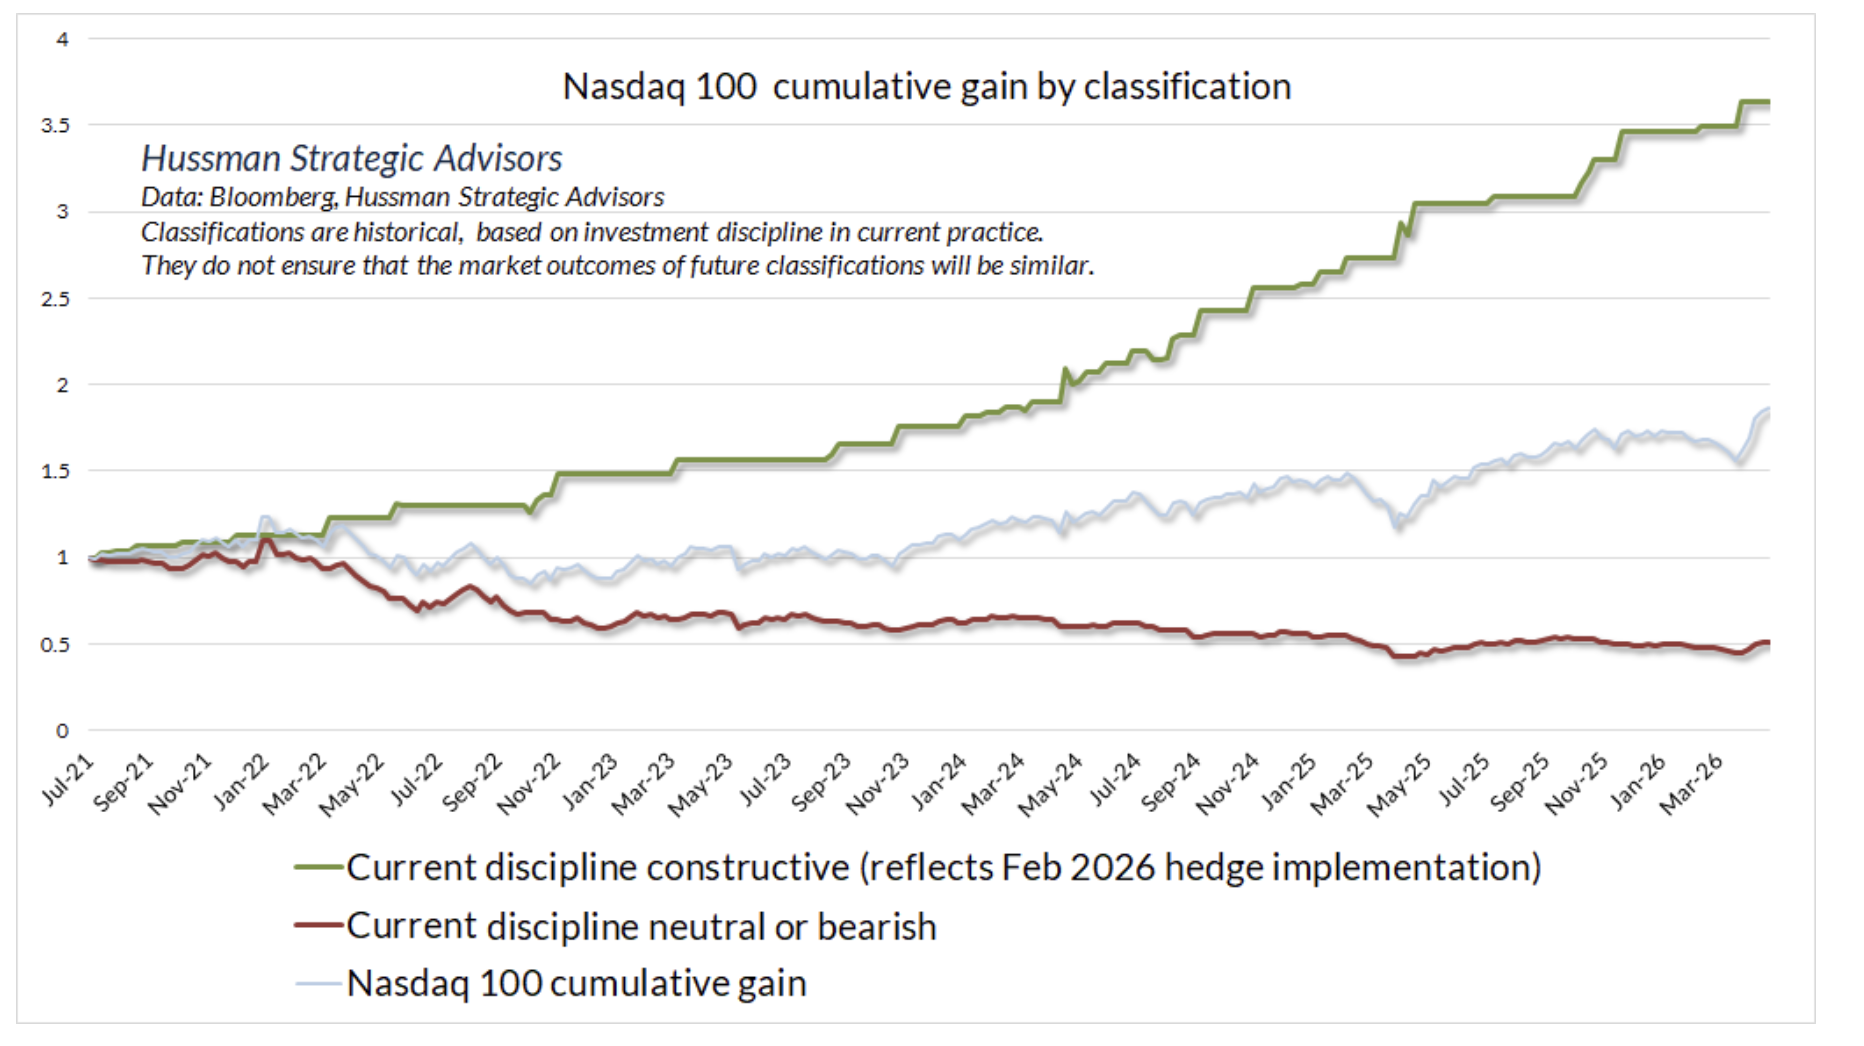
The green line in the chart below shows the cumulative gain of the Nasdaq 100 during periods that our present discipline identifies as “constructive.” What’s notable here isn’t only that 19% of periods since 2021 comprise the entire gain in the index during this period, but equally important, that they have “missed” most of the advance of recent weeks. That’s ok. Nothing requires one to chase the index in the present moment, at its most speculative extreme in history.
For those of you who have placed your trust in our research and investment discipline, my hope here is to offer some perspective, on the markets themselves, on our recent hedging implementations, and on our expectations looking forward. There will be times that our behavior will seem different from the past, and there’s no assurance the outcomes of these “roses” will always be positive (hence the safety nets). Still, I do believe that we can look ahead without fearing a continued bubble, without fearing a market crash, knowing that we’ve got a risk-conscious discipline in place regardless of market outcomes.
On the role of “alternative” investment disciplines
As a side note, it may be helpful for investors to consider the role of alternative investments in a portfolio. As I’ve noted before, if an investor has the choice of allocating between the market portfolio, a risk-free security, and some asset A, with the goal of maximizing expected return given some target level of risk, they will take an “active” position in security A if they believe it will provide them an “edge” – an expected return above what they would normally expect based on its sensitivity to market fluctuations. This is true not only for an individual stock, but for any asset in the “alternative sleeve” of an investment portfolio. Even a flat return with negative market correlation can raise the return/risk profile of a portfolio invested between the market index and the alternative investment strategy.
Geek’s Note: See the last section of Equilibrium and the Dentist in Poughkeepsie if you’re interested in the math: the basic criterion for a positive exposure to the alternative asset is ERa > Rf + beta(ERm – Rf)
If we look at a given investment as a separate entity, rather than an interrelated part of a portfolio, we may not understand it yet. In 2019, we suspended taking bearish outlooks during periods of favorable market internals – even amid extreme valuations. If we look at a blended portfolio divided between the S&P 500 and our own investment discipline since that time, we find that the Sharpe ratio – the annualized return over-and-above T-bills, per unit of volatility – reaches its maximum at an allocation of about 50/50. Even though we didn’t enjoy the “upside capture” that we expect going forward, an asset mix with an alternative sleeve, even since 2019, has had a higher return per unit of risk than the S&P 500 itself.
Needless to say, our effort is for the Sharpe ratio of a blended portfolio to reach its maximum at an even higher allocation to our investment discipline, and also a higher return than the S&P 500 itself, which was our norm in market cycles before the current bubble. That’s a work in progress, but then, having a broader scope for upside capture – even amid garbage and trap doors – is work that we can happily to put to use.
On the care and feeding of the roses (and the garbage)
Through most of this brief comment, I’ve been a bit reductive talking about “roses amid garbage” only in a financial sense – when the image carries far deeper meaning. Whatever difficulty we may be facing at a given moment, whether in the financial markets, in our relationships, in our world, it can help to remember that everything has causes and conditions – this is because that is, this is not because that is not.
When we look at a situation, or a person, or ourselves like that, it becomes less of a solid thing that exists on its own. Instead, we start to see its seeds, its impermanence – it emerges when causes and conditions are like this, it ceases to manifest when causes and conditions are no longer like this. So instead of being attached to the rose, or averse to the garbage, as if they are separate things, we may get an insight that each of them contains some of the other. The best thing we can do is take good care of our roses while they’re here, and to look compassionately enough at what we call “garbage” to see its causes and conditions – we may even see that there are roses there, that we can cultivate into becoming. We have more clarity about what to do, and what not to do.
My beloved friend and revered teacher Thich Nhat Hanh (“Thay”), a Vietnamese Buddhist monk, once wrote a little verse of four characters on a lampshade. It said, “If you want peace, peace is with you immediately.” The same is true of happiness. If you want it, there are already enough causes and conditions in you and around you to be happy right away. They are available, in plain sight. If we can first establish peace and happiness in ourselves, we may be available to do something for the world. If we can’t even smile, or look at what we’ve labeled as “garbage” with the eyes of compassion and non-discrimination, we may not even have sovereignty over ourselves. We can regain it right away. The smile on our face, and our capacity to look at our difficulties, at others, at the world, with the eyes of compassion, are the things that tell us we’ve reclaimed our freedom.
To see the interrelatedness of things – what Thay called “interbeing” – changes the way you think, the way you relate to others, the way you move through the world. It may even bring the one additional insight that solves your difficulty.
Sometimes it’s the only thing that finally can.
We see a beautiful rose in a vase and think it is immaculate. Its fragrance is pure and fresh. It supports our idea of purity. The opposite is a garbage can. We identify this as defiled. But if we look deeply at the concepts of defiled and pure, we have a chance to touch the insight of interbeing. In just five or six days, the rose will become part of the garbage. We do not need to wait five days to see this. If we just look deeply at the rose, we can see it now. And if we look deeply into the garbage can, we see that in a few months its contents can be transformed into a rose.
If you are a good organic gardener, if you have the eyes of a bodhisattva, looking at a rose you can see the garbage, and looking at the garbage you can see a rose. Roses and garbage inter-are. Without a rose, we cannot have garbage; and without garbage, we cannot have a rose. The rose and garbage are equally important. The garbage is just as precious as the rose. When you perceive reality in this way, you will not discriminate against the garbage in favor of the rose. You will cherish both.
– Thich Nhat Hanh
The foregoing comments represent the general investment analysis and economic views of the Advisor, and are provided solely for the purpose of information, instruction and discourse.
Prospectuses for the Hussman Strategic Market Cycle Fund, the Hussman Strategic Total Return Fund, and the Hussman Strategic Allocation Fund, as well as Fund reports and other information, are available by clicking Prospectus & Reports under “The Funds” menu button on any page of this website.
The S&P 500 Index is a commonly recognized, capitalization-weighted index of 500 widely-held equity securities, designed to measure broad U.S. equity performance. The Bloomberg U.S. Aggregate Bond Index is made up of the Bloomberg U.S. Government/Corporate Bond Index, Mortgage-Backed Securities Index, and Asset-Backed Securities Index, including securities that are of investment grade quality or better, have at least one year to maturity, and have an outstanding par value of at least $100 million. The Bloomberg US EQ:FI 60:40 Index is designed to measure cross-asset market performance in the U.S. The index rebalances monthly to 60% equities and 40% fixed income. The equity and fixed income allocation is represented by Bloomberg U.S. Large Cap Index and Bloomberg U.S. Aggregate Index. You cannot invest directly in an index.
Estimates of prospective return and risk for equities, bonds, and other financial markets are forward-looking statements based the analysis and reasonable beliefs of Hussman Strategic Advisors. They are not a guarantee of future performance, and are not indicative of the prospective returns of any of the Hussman Funds. Actual returns may differ substantially from the estimates provided. Estimates of prospective long-term returns for the S&P 500 reflect our standard valuation methodology, focusing on the relationship between current market prices and earnings, dividends and other fundamentals, adjusted for variability over the economic cycle. Further details relating to MarketCap/GVA (the ratio of nonfinancial market capitalization to gross-value added, including estimated foreign revenues) and our Margin-Adjusted P/E (MAPE) can be found in the Market Comment Archive under the Knowledge Center tab of this website. MarketCap/GVA: Hussman 05/18/15. MAPE: Hussman 05/05/14, Hussman 09/04/17.
Disclosure Notice
Performance data quoted represents past performance. Past performance does not guarantee future results. Investment return and principal value of an investment will fluctuate so that an investor’s shares, when redeemed, may be worth more or less than their original cost. Current performance may be lower or higher than the performance data quoted. More current performance data through the most recent month-end are available at the Fund’s website www.hussmanfunds.com or by calling 1-800-487-7626.
Investors should consider the investment objectives, risks, and charges and expenses of the Funds carefully before investing. For this and other information, please obtain a Prospectus and read it carefully.
The Hussman Funds have the ability to vary their exposure to market fluctuations depending on overall market conditions, and they may not track movements in the overall stock and bond markets, particularly over the short-term. While the intent of this strategy is long-term capital appreciation, total return, and protection of capital, the investment return and principal value of each Fund may fluctuate or deviate from overall market returns to a greater degree than other funds that do not employ these strategies. For example, if a Fund has taken a defensive posture and the market advances, the return to investors will be lower than if the portfolio had not been defensive. Alternatively, if a Fund has taken an aggressive posture, a market decline will magnify the Fund’s investment losses. The Distributor of the Hussman Funds is Ultimus Fund Distributors, LLC., 225 Pictoria Drive, Suite 450, Cincinnati, OH, 45246.
The Hussman Strategic Market Cycle Fund has the ability to hedge market risk by selling short major market indices in an amount up to, but not exceeding, the value of its stock holdings. However, the Fund may experience a loss even when the entire value of its stock portfolio is hedged if the returns of the stocks held by the Fund do not exceed the returns of the securities and financial instruments used to hedge, or if the exercise prices of the Fund’s call and put options differ, so that the combined loss on these options during a market advance exceeds the gain on the underlying index. The Fund also has the ability to leverage the amount of stock it controls to as much as 1 1/2 times the value of net assets, by investing a limited percentage of assets in call options.
The Hussman Strategic Allocation Fund invests primarily in common stocks, bonds, and cash equivalents (such as U.S. Treasury bills and shares of money market mutual funds, aligning its allocations to these asset classes based on prevailing valuations and estimated expected returns in these markets. The investment strategy adds emphasis on risk-management to adjust the Fund’s exposure in market conditions that suggest risk-aversion or speculation among market participants. The Fund may use options and futures on stock indices and Treasury bonds to adjust its relative investment exposures to the stock and bond markets, or to reduce the exposure of the Fund’s portfolio to the impact of general market fluctuations when market conditions are unfavorable in the view of the investment adviser.
The Hussman Strategic Total Return Fund has the ability to hedge the interest rate risk of its portfolio in an amount up to, but not exceeding, the value of its fixed income holdings. The Fund also has the ability to increase the interest rate exposure of its portfolio through limited purchases of Treasury zero-coupon securities and STRIPS. The Fund may also invest up to 30% of assets in alternatives to the U.S. fixed income market, including foreign government bonds, utility stocks, convertible bonds, real-estate investment trusts, and precious metals shares.
The Prospectus of each Fund contains further information on investment objectives, strategies, risks and expenses. Please read the Prospectus carefully before investing.
The Market Climate is not a formula but a method of analysis. The term “Market Climate” and the graphics used to represent it are service marks of Hussman Strategic Advisors (formerly known as Hussman Econometrics Advisors). The Fund Manager has sole discretion in the measurement and interpretation of market conditions. Information relating to the investment strategy of each Fund is described in its Prospectus and Statement of Additional Information. A schedule of investment positions for each Fund is presented in the annual and semi-annual reports. Except for articles specifically citing investment positions held by the Funds, general market commentary does not necessarily reflect the investment position of the Funds.
A message from Advisor Perspectives and VettaFi: Discover something new! Click here to register for our upcoming webcasts.
Membership required
Membership is now required to use this feature. To learn more:
View Membership BenefitsSponsored Content
Upcoming Virtual Events View All


