Risk appetite remains firmly intact as optimism surrounding a potential resolution to the war with Iran continues to improve investor sentiment. The S&P 500 has now advanced for eight consecutive weeks, with price action remaining remarkably resilient throughout the recovery. Since bottoming on March 30, the index has gained roughly 18% over just 39 trading sessions, producing an average daily gain of more than 0.8% while experiencing a maximum drawdown of only 1.2% during the advance. While easing geopolitical tensions and an ongoing ceasefire framework have provided a major catalyst for the rally, strong corporate earnings have also played a critical role in sustaining momentum.
According to LPL Chief Equity Strategist Jeffrey Buchbinder, first-quarter S&P 500 earnings growth is currently tracking near 28% year over year. The Magnificent Seven accounted for more than 15 percentage points of that growth, though the remaining “S&P 493” are still expected to deliver earnings growth near 20%, highlighting that underlying fundamentals outside of mega cap technology remain healthy.
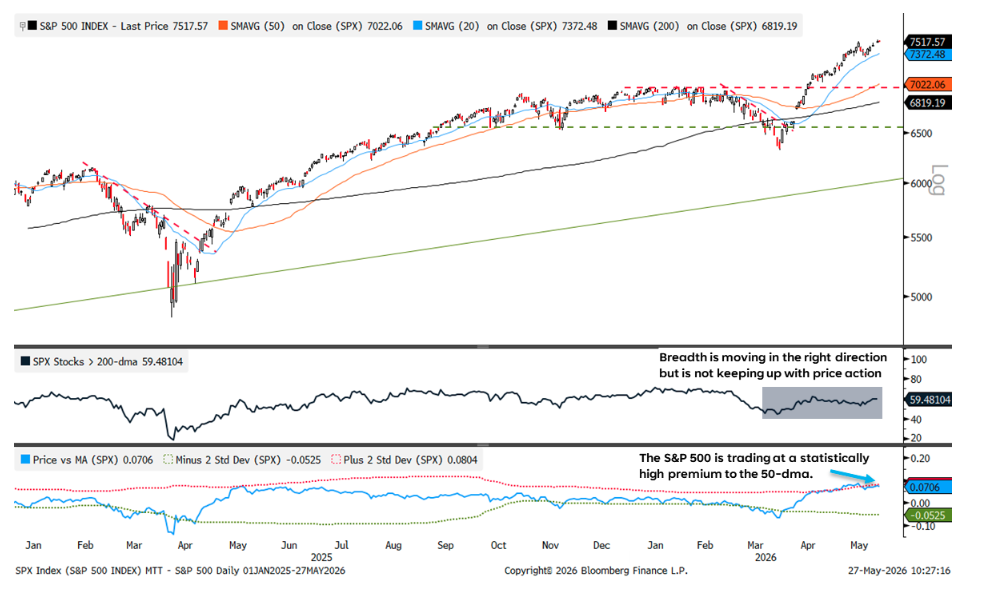
From a technical perspective, the S&P 500 regained momentum quickly after gapping above its 200-day moving average (dma) in April and has since moved decisively to new record highs above the 7,000-point milestone. Momentum indicators continue to confirm the bullish trend, although several measures are now approaching short-term overbought territory following the magnitude and speed of the advance.
Read more: Seeds of Opportunity: The Case for Agriculture Investments
Market breadth, however, remains a more cautious part of the recovery story. Breadth indicators have diverged from price action over the last month, suggesting participation beneath the surface has not fully kept pace with the index-level rally. Currently, only about 60% of S&P 500 constituents are trading above their 200-dma, below the historical average of roughly 73% typically seen when the index is making new highs. Still, narrow breadth has not prevented this large cap-led bull market from extending higher, as periods of concentrated leadership have often been followed by broader sector and style rotations once mega cap momentum begins to cool.
A similar pattern unfolded last year when large cap technology stocks led the market sharply higher off the April lows before eventually consolidating as leadership broadened into value stocks, small caps, and other cyclical areas of the market last fall. The current environment appears to be following a comparable script, with mega cap technology and semiconductor-related names once again carrying much of the market through major resistance levels.
Technology leadership remains exceptionally strong, with the sector continuing to reach new highs on both an absolute and relative basis. However, increasingly stretched momentum conditions and elevated positioning suggest the rally may be becoming more vulnerable to short-term consolidation. Semiconductor and memory-related stocks have experienced parabolic advances since the March lows, with several momentum indicators reaching historically elevated levels. While overbought conditions alone are not necessarily bearish, the probability of near-term profit taking or rotational activity appears to be rising as investor positioning becomes increasingly crowded.
Records on Repeat for the Broader Mark

Internal Outperformance
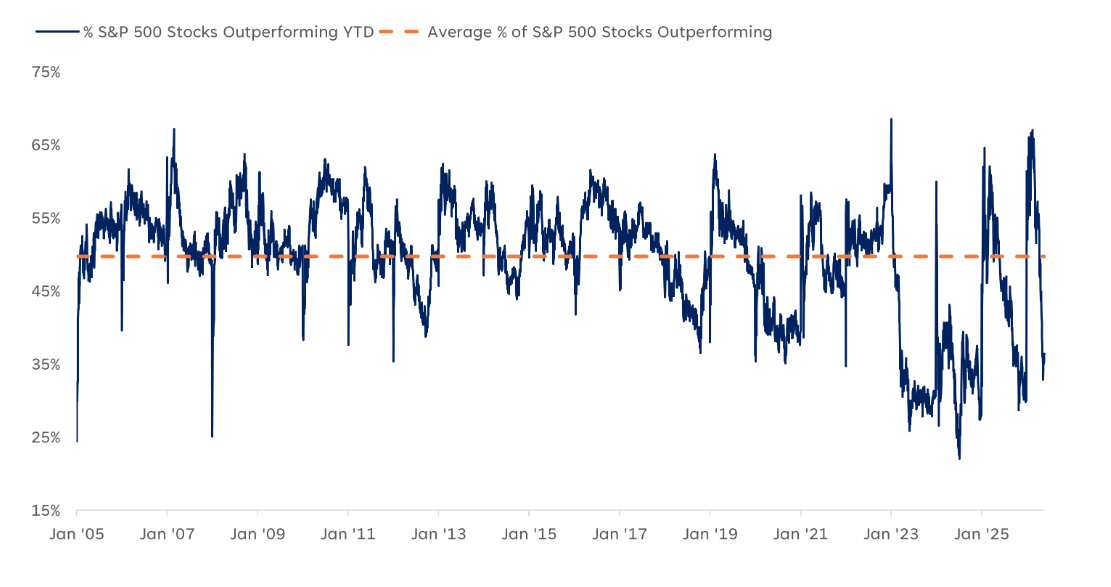
Another way to assess participation is to analyze how many stocks are outperforming the broader index. As the rotation from last fall gained traction into 2026, just over two-thirds of S&P 500 constituents were outperforming the index on the year in mid-February. Historically, that level has represented the upper end of participation breadth over the last two decades in our dataset.
Since then, leadership has rotated back toward growth and big tech, driving the percentage of stocks outperforming the index down to roughly 33% earlier this month. That level is approaching a historically narrow participation extreme, which has often preceded broader market rotations. In fact, following the previous seven instances where internal outperformance reached similarly depressed levels, large cap value and small cap stocks outperformed both large cap growth and the broader S&P 500 over the subsequent one-, three-, and six-month periods.
Historically Narrow Leadership May Be Setting the Stage for Rotation
Conclusion
The S&P 500 continues to exhibit strong momentum, supported by growing optimism surrounding a resolution to the conflict with Iran and the eventual reopening of the Strait of Hormuz. Corporate earnings have provided another important tailwind, particularly within large cap technology, where strong results continue to reinforce the longer-term artificial intelligence growth narrative. At the same time, increasingly stretched momentum conditions are beginning to emerge following the market’s largely one-way advance, especially across semiconductor and memory-related stocks that have experienced parabolic moves higher in recent months.
Investor sentiment and positioning within the technology space have also become increasingly crowded from a contrarian perspective, leaving us somewhat cautious over the near term as the probability of consolidation or a pullback appears elevated. Longer term, we remain constructive on the secular bull market backdrop but recognize market advances rarely unfold in such a linear fashion. In addition, historically low levels of internal outperformance continue to suggest the potential for a broader rotation away from concentrated large cap growth leadership and into other areas of the market.
A message from Advisor Perspectives and VettaFi: Discover something new! Click here to register for our upcoming webcasts.
Important Disclosures
This material is for general information only and is not intended to provide specific advice or recommendations for any individual. There is no assurance that the views or strategies discussed are suitable for all investors. To determine which investment(s) may be appropriate for you, please consult your financial professional prior to investing.
Investing involves risks including possible loss of principal. No investment strategy or risk management technique can guarantee return or eliminate risk.
Indexes are unmanaged and cannot be invested into directly. Index performance is not indicative of the performance of any investment and does not reflect fees, expenses, or sales charges. All performance referenced is historical and is no guarantee of future results.
This material was prepared by LPL Financial, LLC. All information is believed to be from reliable sources; however LPL Financial makes no representation as to its completeness or accuracy.
Unless otherwise stated LPL Financial and the third party persons and firms mentioned are not affiliates of each other and make no representation with respect to each other. Any company names noted herein are for educational purposes only and not an indication of trading intent or a solicitation of their products or services.
Asset Class Disclosures –
International investing involves special risks such as currency fluctuation and political instability and may not be suitable for all investors. These risks are often heightened for investments in emerging markets.
Bonds are subject to market and interest rate risk if sold prior to maturity.
Municipal bonds are subject and market and interest rate risk and potentially capital gains tax if sold prior to maturity. Interest income may be subject to the alternative minimum tax. Municipal bonds are federally tax-free but other state and local taxes may apply.
Preferred stock dividends are paid at the discretion of the issuing company. Preferred stocks are subject to interest rate and credit risk. They may be subject to a call features.
Alternative investments may not be suitable for all investors and involve special risks such as leveraging the investment, potential adverse market forces, regulatory changes and potentially illiquidity. The strategies employed in the management of alternative investments may accelerate the velocity of potential losses.
Mortgage backed securities are subject to credit, default, prepayment, extension, market and interest rate risk.
High yield/junk bonds (grade BB or below) are below investment grade securities, and are subject to higher interest rate, credit, and liquidity risks than those graded BBB and above. They generally should be part of a diversified portfolio for sophisticated investors.
Precious metal investing involves greater fluctuation and potential for losses.
The fast price swings of commodities will result in significant volatility in an investor's holdings.
This research material has been prepared by LPL Financial LLC.
Not Insured by FDIC/NCUA or Any Other Government Agency | Not Bank/Credit Union Deposits or Obligations | Not Bank/Credit Union Guaranteed | May Lose Value
For Public Use – Tracking: #1115500
Read more commentaries by LPL Financial