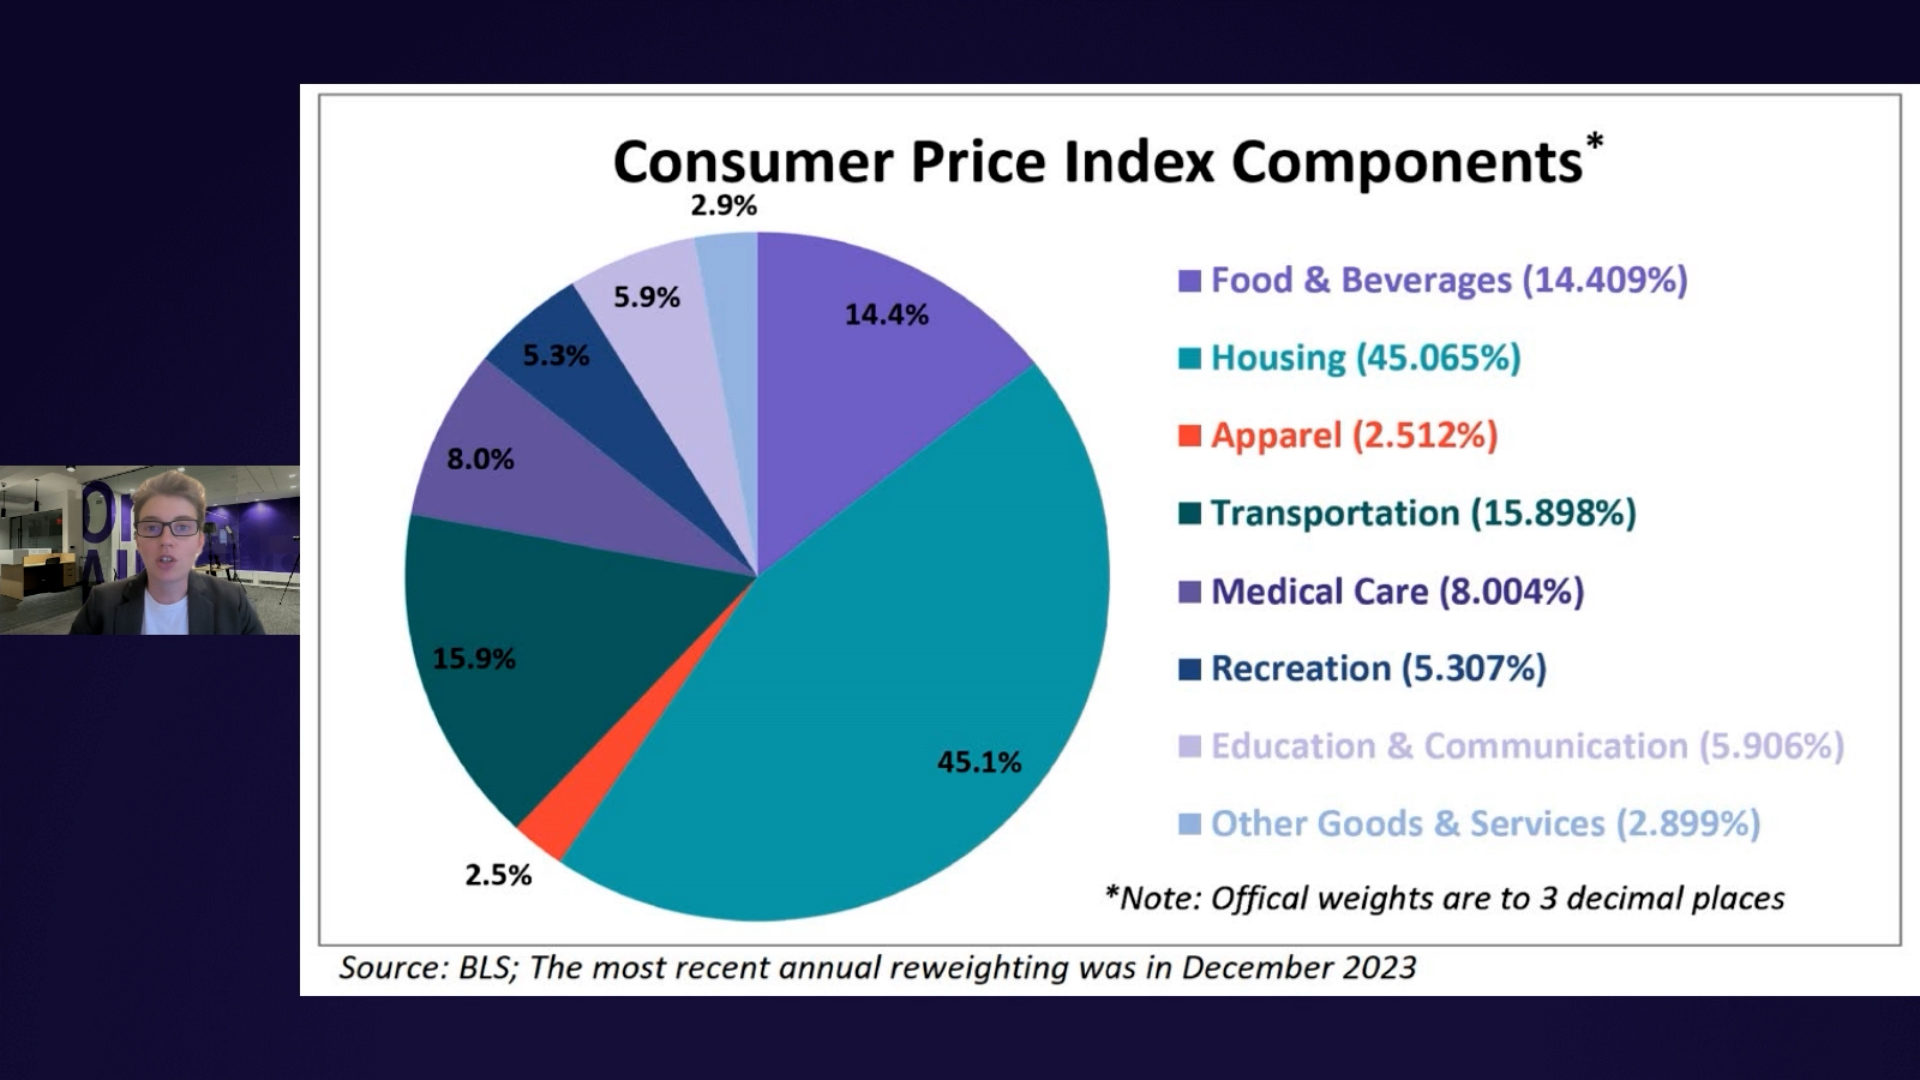
Inflation affects everything from grocery bills to rent, making the Consumer Price Index one of the most closely watched economic indicators. What does inflation mean at the micro level — specifically to your household?
Market valuation indicators are used by investors and analysts to gauge whether markets are overvalued, undervalued, or fairly valued relative to historical norms. Here is a summary of the four market valuation indicators we update monthly.
This video provides an update on the monthly moving averages we track for the S&P 500 and the Ivy Portfolio after the close of the last business day of the month.
The Chicago Fed's National Activity Index is a monthly indicator designed to gauge overall economic activity and related inflationary pressure. It is a composite of 85 monthly indicators across four broad categories. The CFNAI is a forward-looking indicator that suggests how the economy will likely look in the near term and has been called one of the "most important and overlooked economic numbers". The index is constructed so a zero value for the index indicates that the national economy is expanding at its historical trend (average) rate of growth. Negative values indicate below-average growth, and positive values indicate above-average growth.
Margin debt is the amount of money an investor borrows from their broker via a margin account. Trading with a margin debt can magnify gains because an investor can benefit from the upside of any stock without having to invest 100%, resulting in greater profit. On the flip side, trading with margin debt can also exacerbate losses because if a stock's value were to depreciate, the investor may face a margin call and would need to come up with additional cash to reach the minimum requirement.
The Exchange Conference starts this weekend. The latest Road to Exchange video features keynote Jennifer Morgan, CEO & founder of Connective Communication LLC. VettaFi Senior Industry Analyst Kirsten Chang interviewed Morgan about the upcoming conference.
When we think of the U.S. government's finances, we often focus on the massive debt. But what about the assets? What does Uncle Sam actually own, and which asset is the largest?
Head of research at VettaFi, Todd Rosenbluth interviews Neil Bage, the co-founder of Shaping Wealth about his upcoming workshop "Building a human-centric wealth culture" at the Exchange conference.
Cinthia Murphy, TMX VettaFi Investment Strategist interviews retirement expert and author of "Your Best Financial Life," Anne Lester. Anne will be hosting "Retirement: Communicating with (B)oomers to Gen(Z)," an engaging and exciting workshop at the Exchange conference in Las Vegas.
On the latest Road to Exchange, VettaFi’s Roxanna Islam interviewed author and Bread founder Kyla Scanlon. Scanlon is most known for her work as an influencer and her widely praised book, “In This Economy?,” Scanlon, who dissects and comments on markets in a unique way, will be speaking at the Exchange conference.
This video looks at the 10-year Treasury yield's historical trends since 1962, exploring its relationship with key economic indicators like the Fed Funds Rate (FFR), inflation, and the S&P 500.
On the latest Road to Exchange, VettaFi Head of Research Todd Rosenbluth interviewed Michael Durso, CEO of ShoreHaven Wealth Partners.
Builder confidence fell sharply in February due to concerns on tariffs, elevated mortgage rates, and high housing costs. The National Association of Home Builders (NAHB) Housing Market Index (HMI) dropped to 42 this month, down five points from January. The latest reading was below the 46 forecast.
Roxanna Islam of VettaFi interviews Marguerita Cheng of Blue Ocean Global Wealth
For the latest Road to Exchange video, TMX VettaFi Investment Strategist Cinthia Murphy interviewed Lead-Lag Report publisher Michael Gayed. The two discussed market uncertainty, trusted filters, and the value of in-person events.
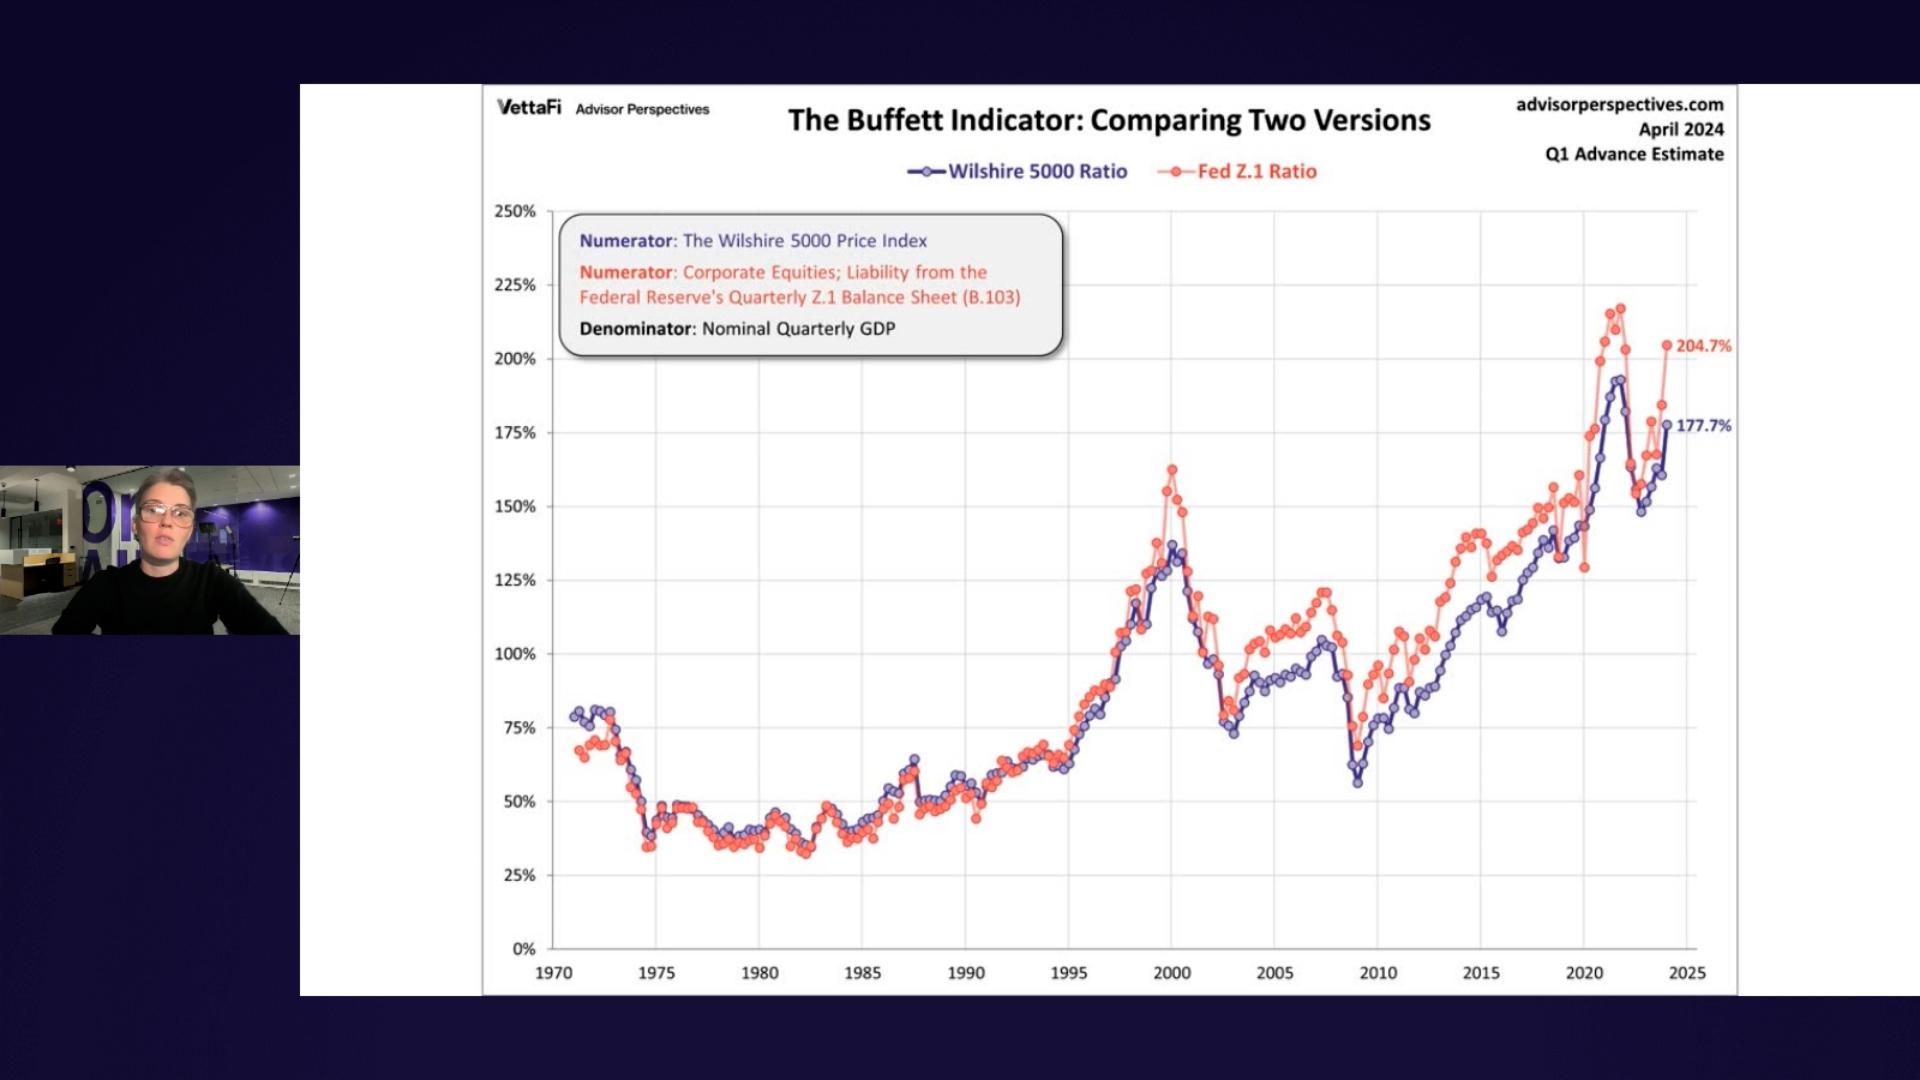
The Buffett Indicator, also known as Market Capitalization to GDP Ratio, is a long-term valuation indicator for stocks that has become popular in recent years, thanks to Warren Buffett. Back in 2001, he remarked in a Fortune Magazine interview that "it is probably the best single measure of where valuations stand at any given moment." It is a measure of the total market value of all publicly-traded stocks in a country divided by the country's GDP and can be used as a way to assess whether the country's stock market is undervalued, fair valued, or overvalued.
The Exchange conference is right around the corner, starting March 23 in Las Vegas. VettaFi Senior Industry Analyst Kirsten Chang interviewed legendary advisor Jeff Concepcion for the latest installment of Road to Exchange. Concepcion is the founder and CEO of Stratos Wealth Partners. For seven years running he has been on Barron’s Top 100 RIA’s list.
Market valuation indicators are used by investors and analysts to gauge whether markets are overvalued, undervalued, or fairly valued relative to historical norms. Tune in for a summary of the four market valuation indicators we update monthly.
The Ivy Portfolio is based on the asset allocation strategy used by endowment funds from Harvard and Yale. It is an equally weighted portfolio constructed with 5 ETFs that feature a mix of different asset classes. By allocating across different asset classes, diversification is achieved, and risk is reduced.
A few months ago, the Census Bureau released its annual report on household income data for 2023. During 2023, the median (middle) average household income rose 8.0% to $80,730. Let's take a closer look at the quintile averages, which dates from 1967, along with the statistics for the top 5%.
This chart series features an overlay of the Four Bad Bears in U.S. history since the equity market peak in 1929. The numbers are through the December 31, 2024 close. These charts are not intended as a forecast but rather as a way to study the current market in relation to historic market cycles.
With more than $1 billion of net inflows, there's been a lot of ETF success stories in 2024. VettaFi Voices come together to discuss them and preview 2025.
In the latest episode of ETF 360, Kirsten Chang was joined by Rockefeller Asset Management’s Director of Fixed Income Alex Petrone.
VettaFi Voices dive into actively managed and fixed income trends in the ETF market in what is likely to be a record year for industry flows.
This week’s episode features Barry Peters from Winslow Capital along with TMX VettaFi's Kirsten Chang discussing IWFG
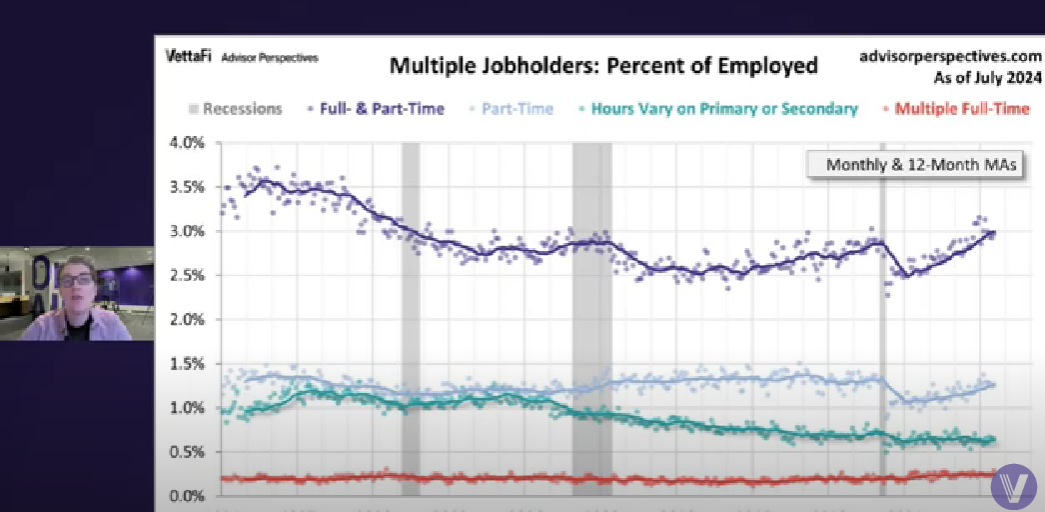
What are the long-term trends for multiple jobholders in the US? The Bureau of Labor Statistics has three decades of historical data to enlighten us on that topic, courtesy of table A-16 in the monthly Current Population Survey of households.
VettaFi Voices weigh in on key industry trends in 2024.
Official recession calls are the responsibility of the NBER Business Cycle Dating Committee, which is understandably vague about the specific indicators on which they base their decisions. This committee statement is about as close as they get to identifying their method.
The RecessionAlert weekly leading economic index (WLEI) is a composite for the U.S economy that draws from over 20 time-series and groups them into the following six broad categories which are then used to construct an equally weighted average.
Jane Edmondson, Head of Thematic Strategy for VettaFi interviews MUSQ Founder and CEO David Schulhof about the Index behind the MUSQ ETF, providing pure-play exposure to the global music industry.
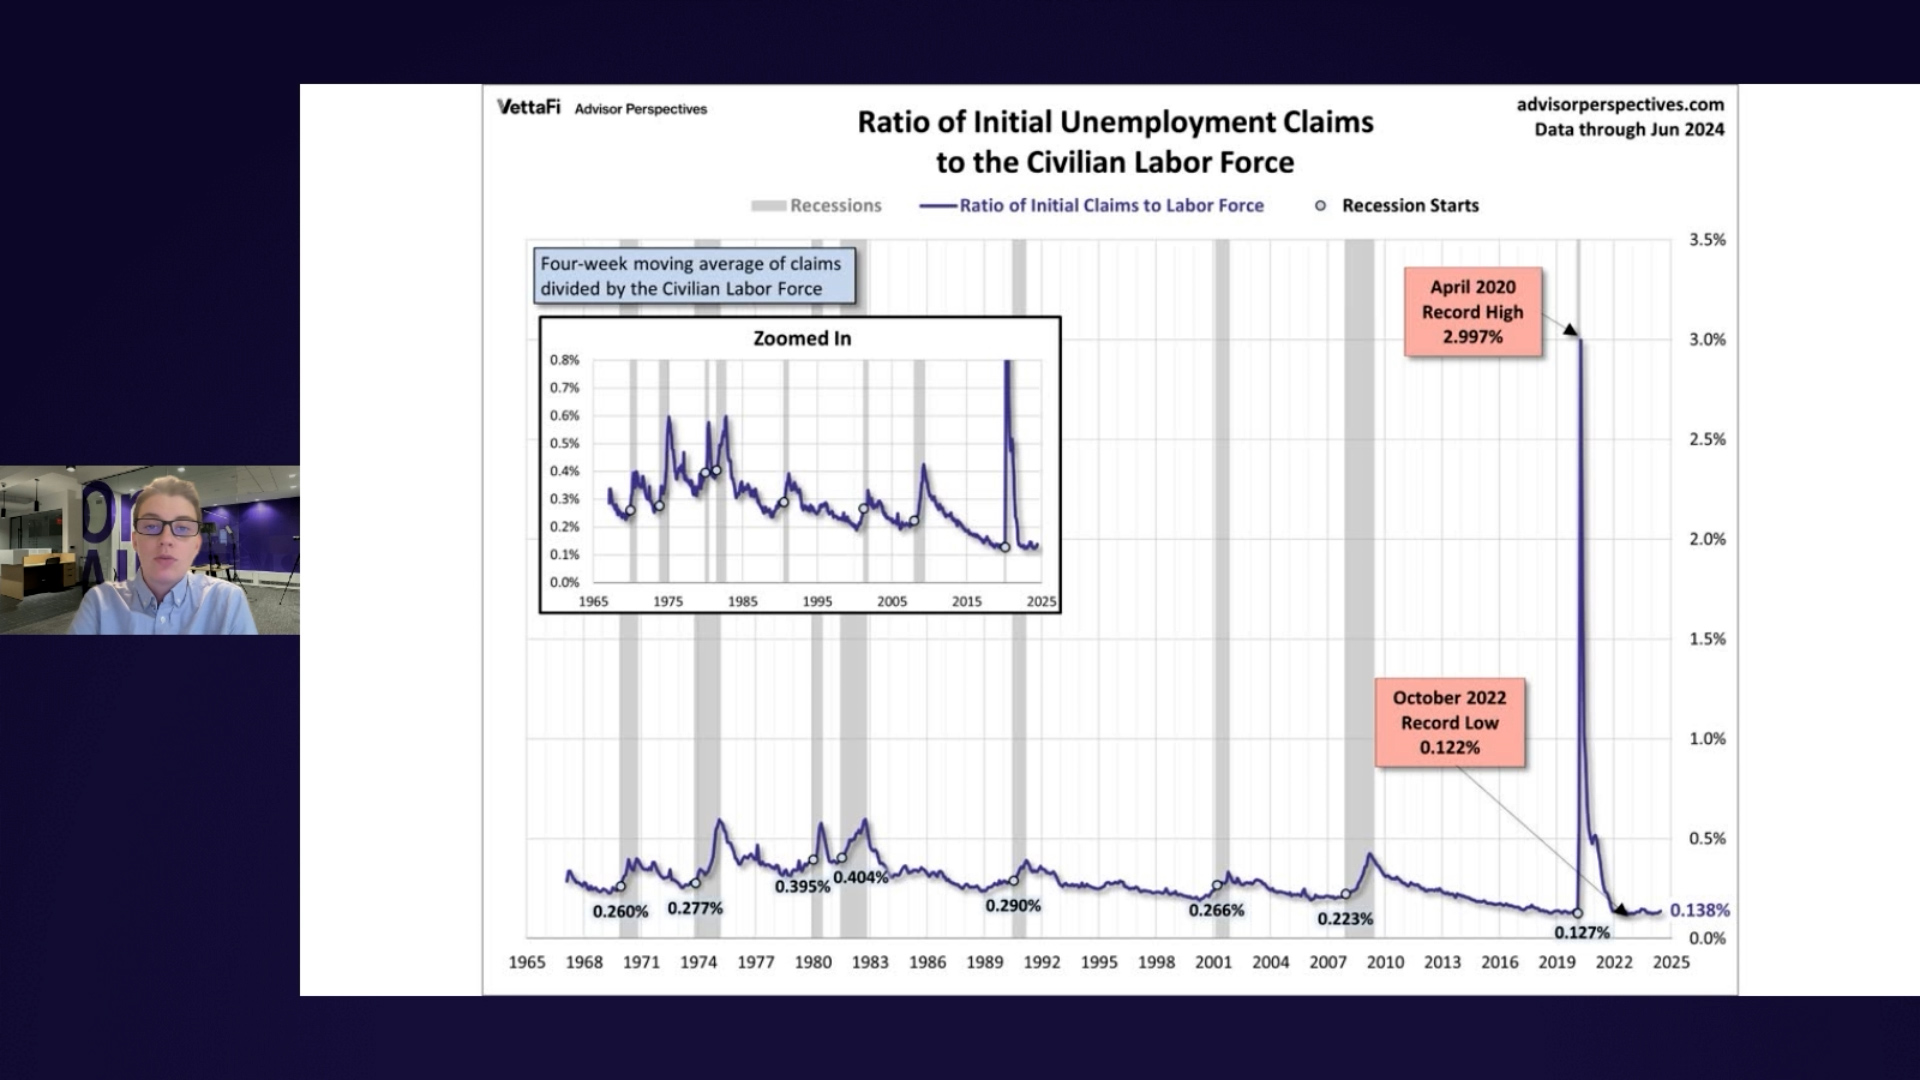
Every week I post an update on new unemployment claims shortly after the BLS report is made available. Our focus is the four-week moving average of this rather volatile indicator. The financial press generally takes a fairly simplistic view of the latest number, and the market often reacts, for a few minutes or a few hours, to the initial estimate, which is always revised the following week.
A bull market occurs when stocks are rising, the economy is expanding, and there is overall optimism towards market conditions. On the contrary, a bear market occurs when stock prices are falling, the economy is contracting, and there is overall pessimism towards market conditions. There are a handful of theories as to where the "bear" and "bull" names originated from for describing the stock market but the one that I find the most helpful is that they are derived from the way the animals attack their opponents. A bull thrusts its horns up in the air; a bear swipes its paws down.
The latest Conference Board Leading Economic Index (LEI) decreased in May to its lowest level since April 2020. The index fell 0.5% from the previous month to 101.2. While the index does signal softer economic conditions lay ahead, the LEI is currently not signaling a recession.
Let's do some analysis of the Consumer Price Index, the best-known measure of inflation. What does inflation mean at the micro level — specifically to your household?
The S&P 500, Dow Jones Industrial Average (Dow), and Nasdaq Composite are all stock market indexes used to measure the performance of various aspects of the U.S. stock market. The indexes generally rise and fall together, however the extent of gains or losses produced by each can differ depending on market conditions and the state of the economy.
VettaFi reviews key ETF Trends from first half of 2024. We cover active management , index innovation and the growth of alternative investing.
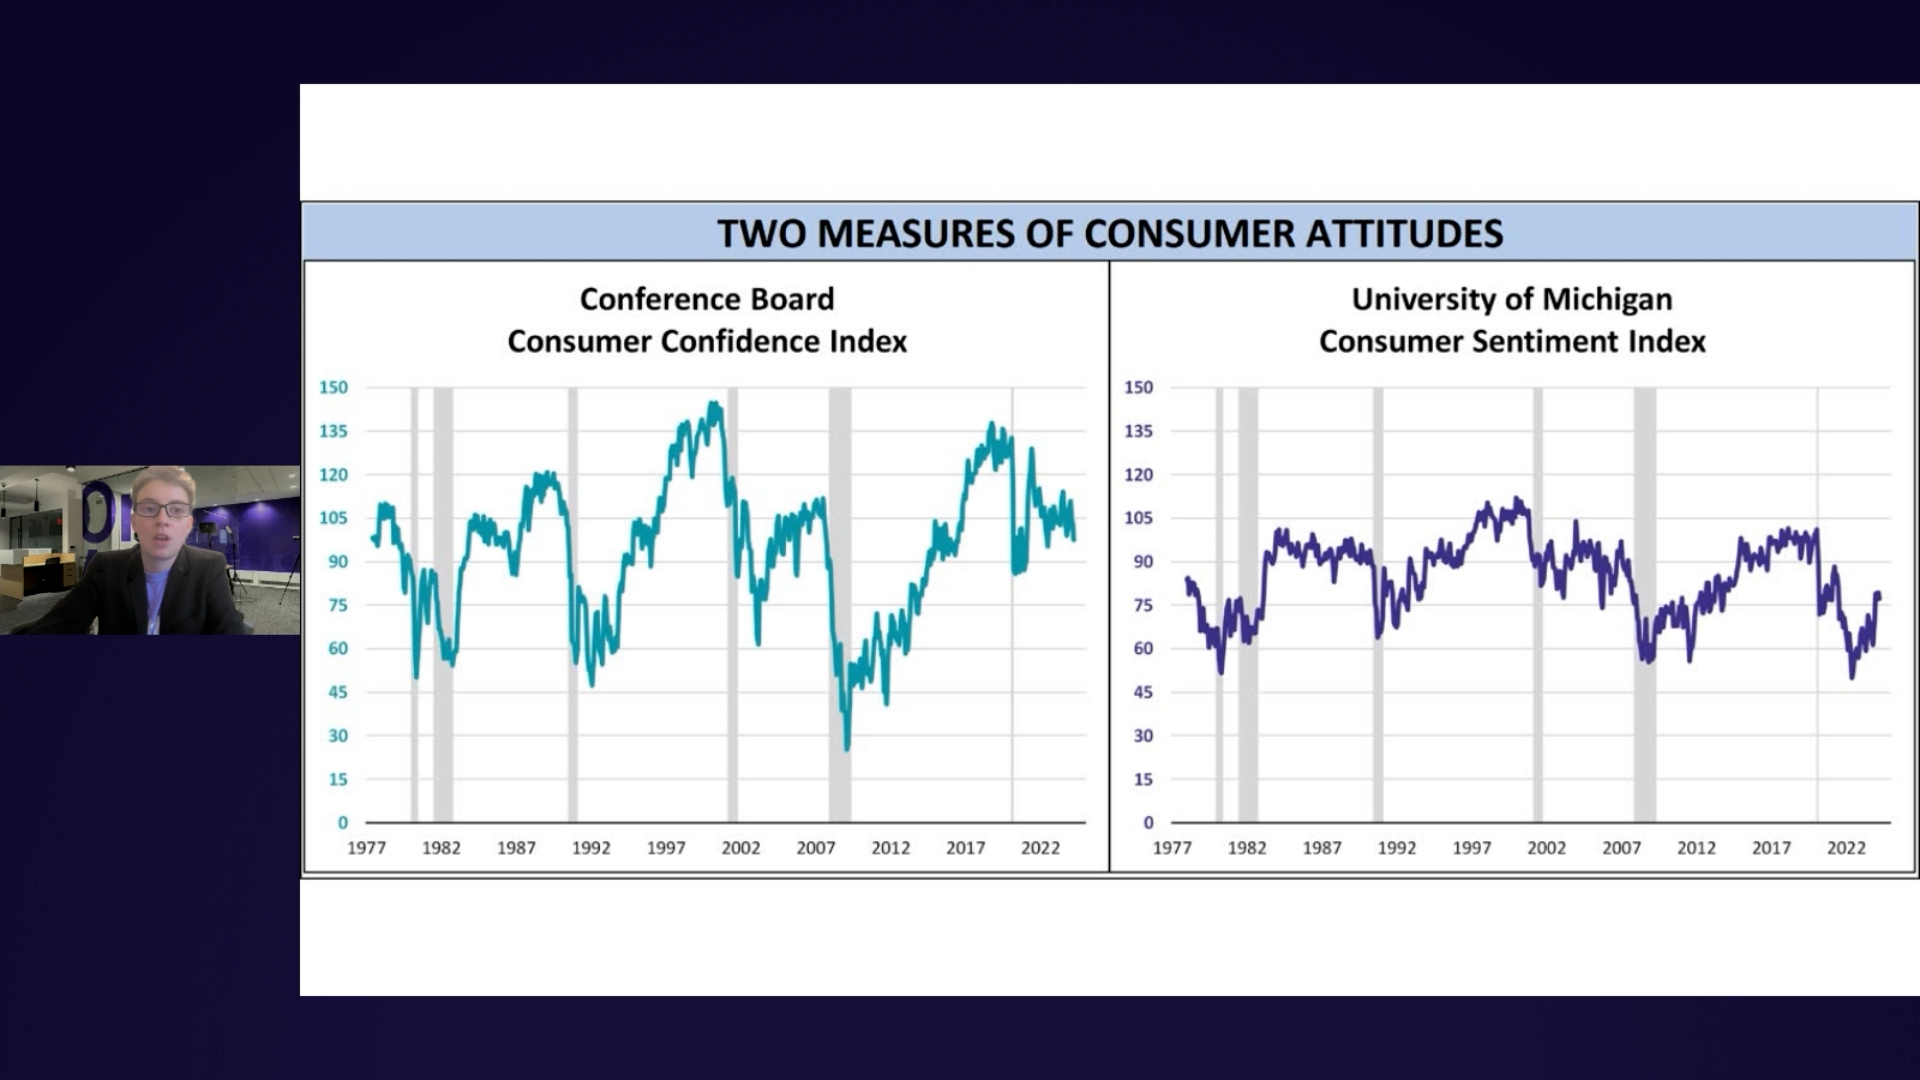
Consumer attitudes are measured by two monthly surveys: the University of Michigan Consumer Sentiment Index (MCSI) and the Conference Board Consumer Confidence Index (CCI). In May, the MCSI fell to its lowest level in six months at 69.1. Meanwhile, the CCI rose for the first time in four months to 102.0.
On Thursday, May 30, VettaFi will host its 2024 Alternatives Symposium. Adding alternative strategies to an investor’s portfolio can provide diversified exposure and potential for returns. VettaFi’s event will highlight the wide variety of alternative solutions that are now available for advisors.
PM Chris Davis on the deep insights he gained from Berkshire Hathaway’s Charlie Munger on successful investing, the importance of stewardship, and “living a life in a web of deserved trust”
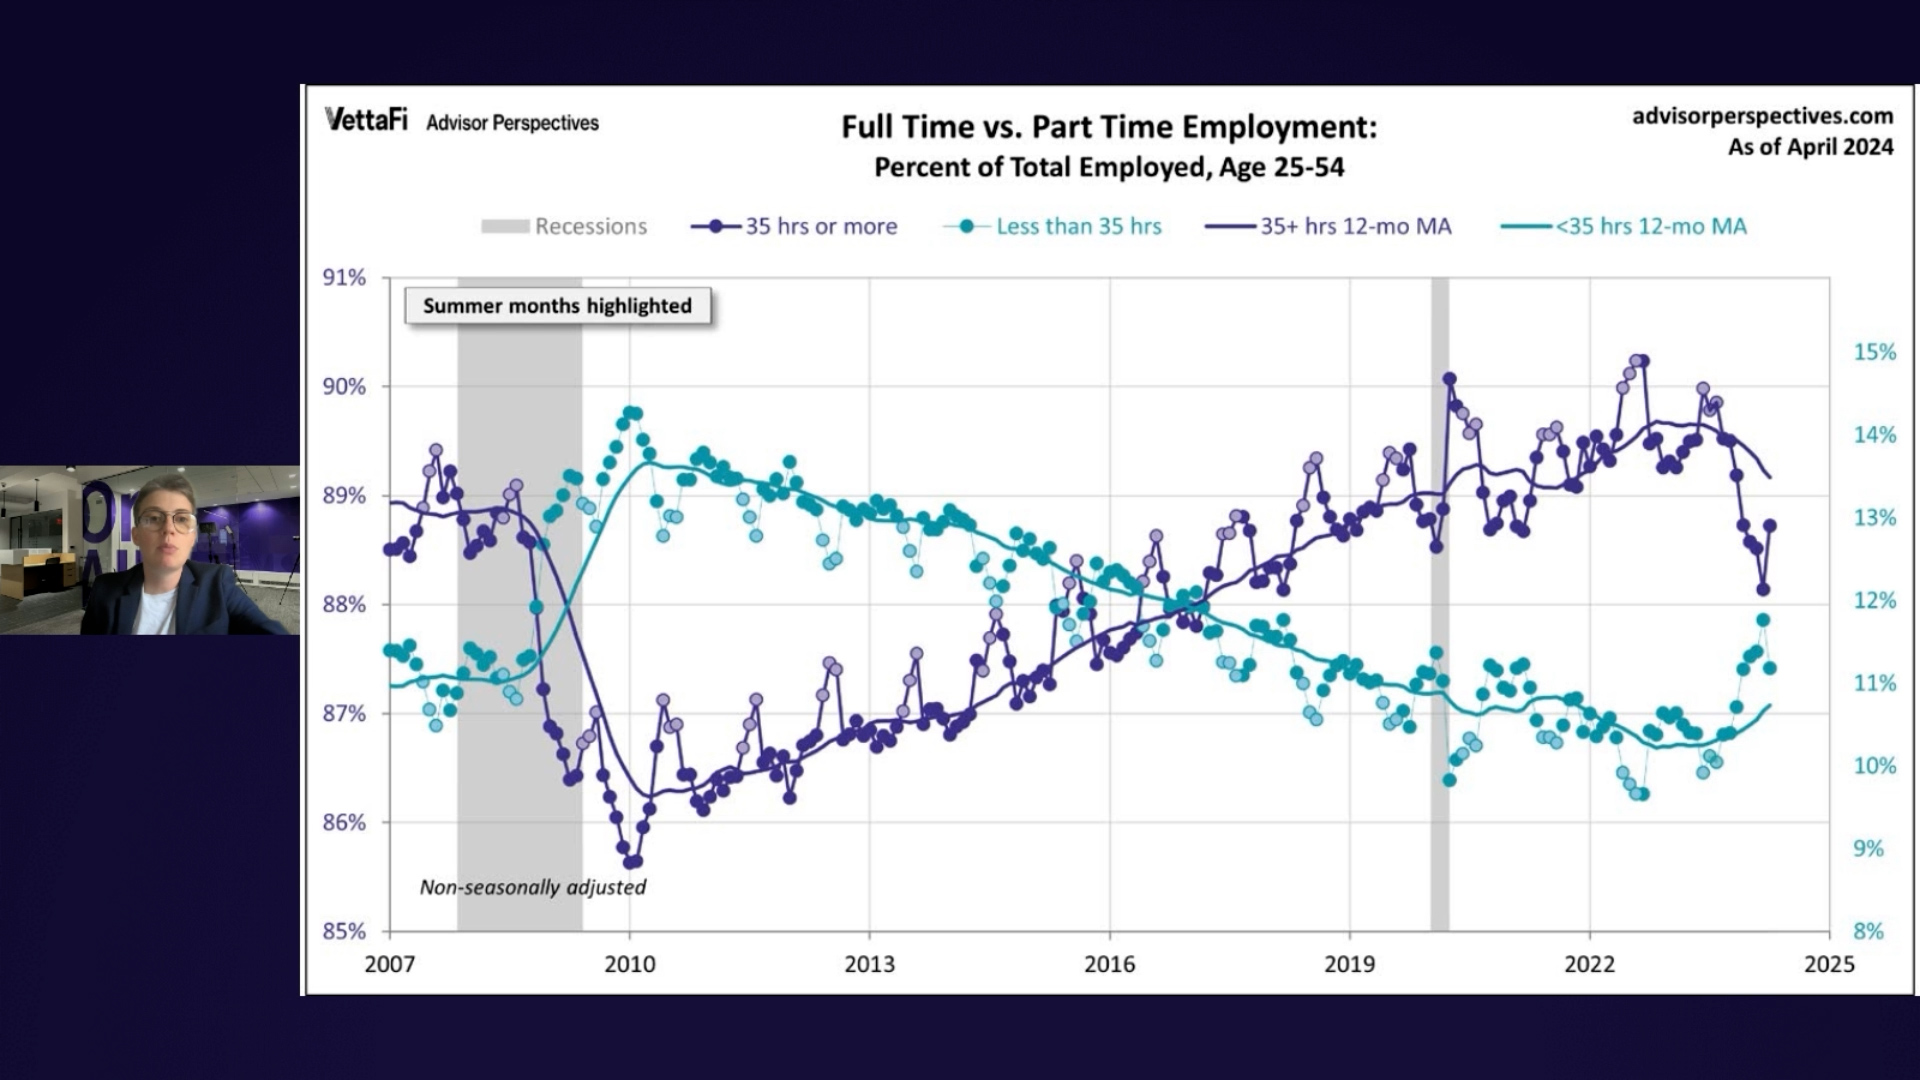
Let's take a closer look at the latest employment report numbers on full- and part-time employment. Buried near the bottom of table A-9 of the government's employment situation summary are the numbers for full- and part-time workers, with 35-or-more hours as the arbitrary divide between the two categories. The source is the monthly current population survey (CPS) of households. The focus is on total hours worked regardless of whether the hours are from a single or multiple jobs.
The Buffett Indicator, also known as Market Capitalization to GDP Ratio is a long-term valuation indicator for stocks that has become popular in recent years, thanks to Warren Buffett. Back in 2001, he remarked in a Fortune Magazine interview that "it is probably the best single measure of where valuations stand at any given moment." It is a measure of the total market value of all publicly-traded stocks in a country divided by the country's GDP and can be used as a way to assess whether the country's stock market is undervalued, fair valued, or overvalued.
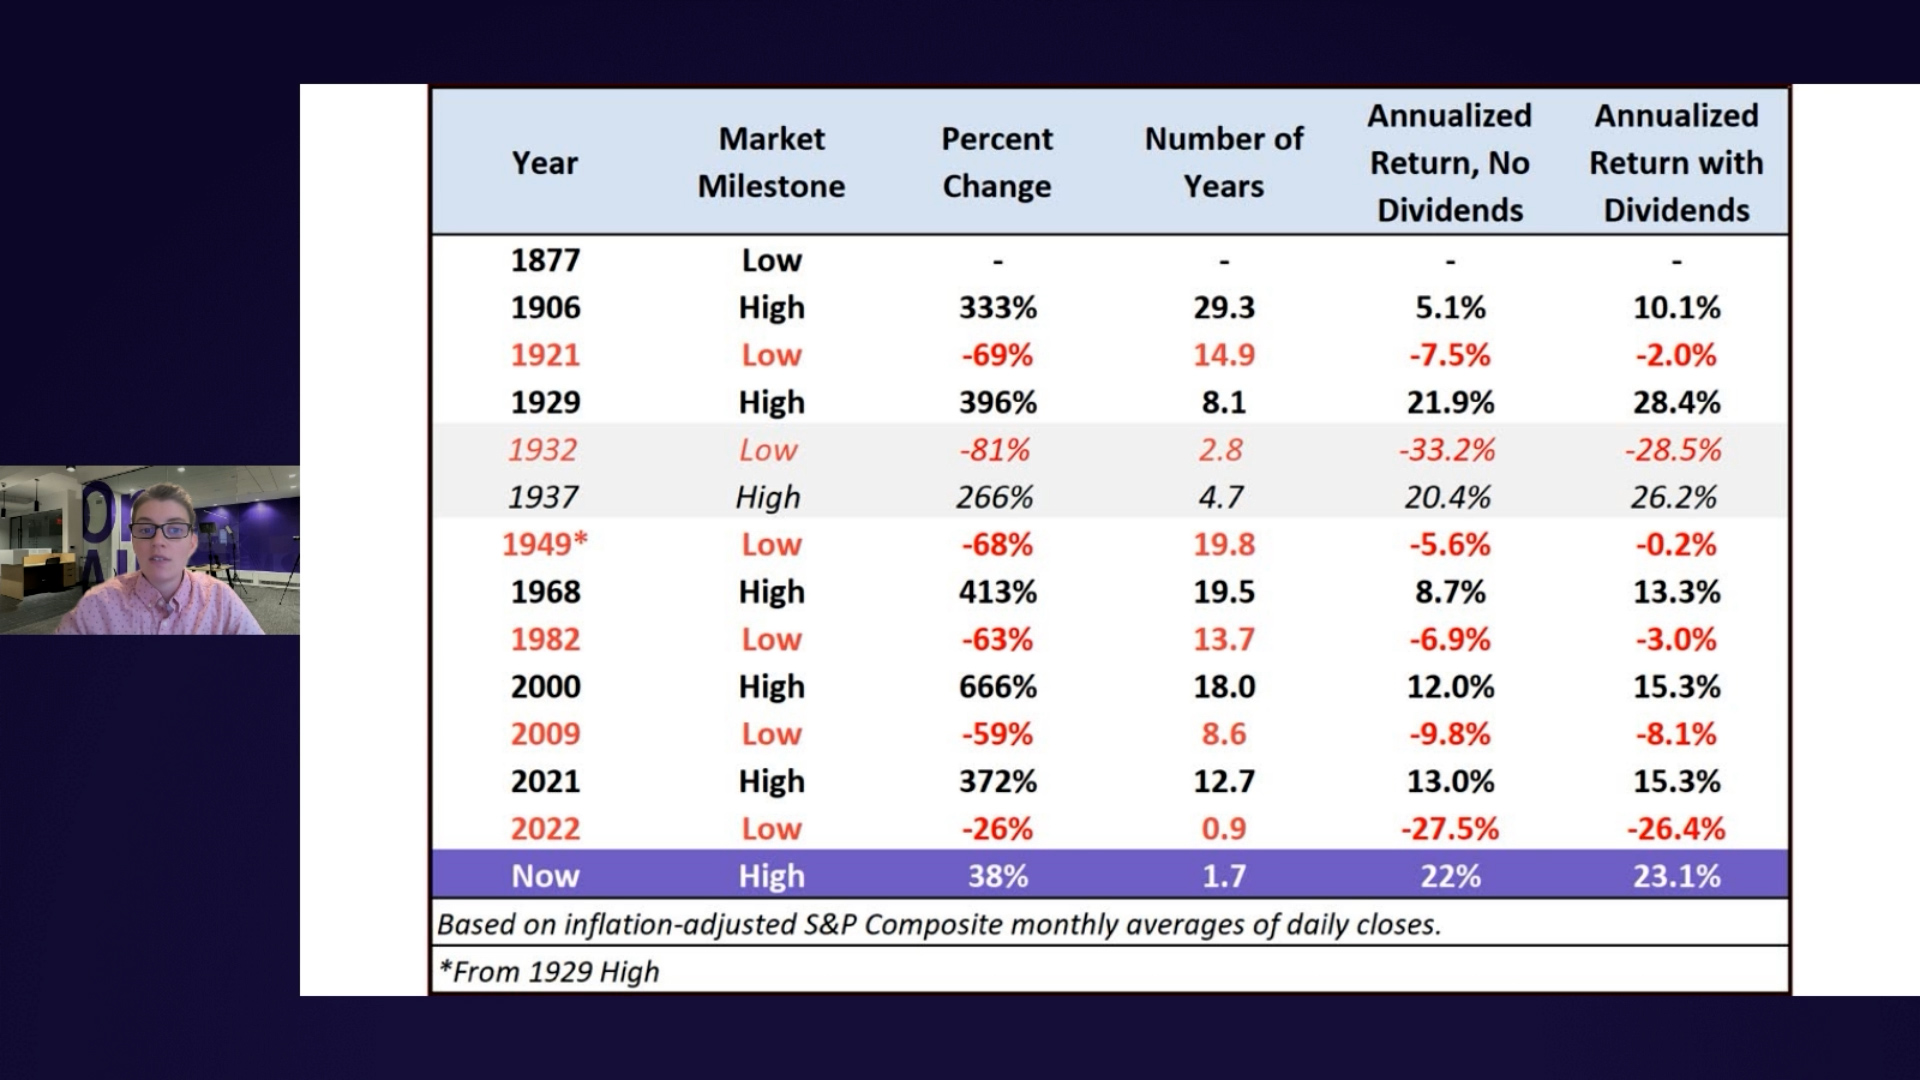
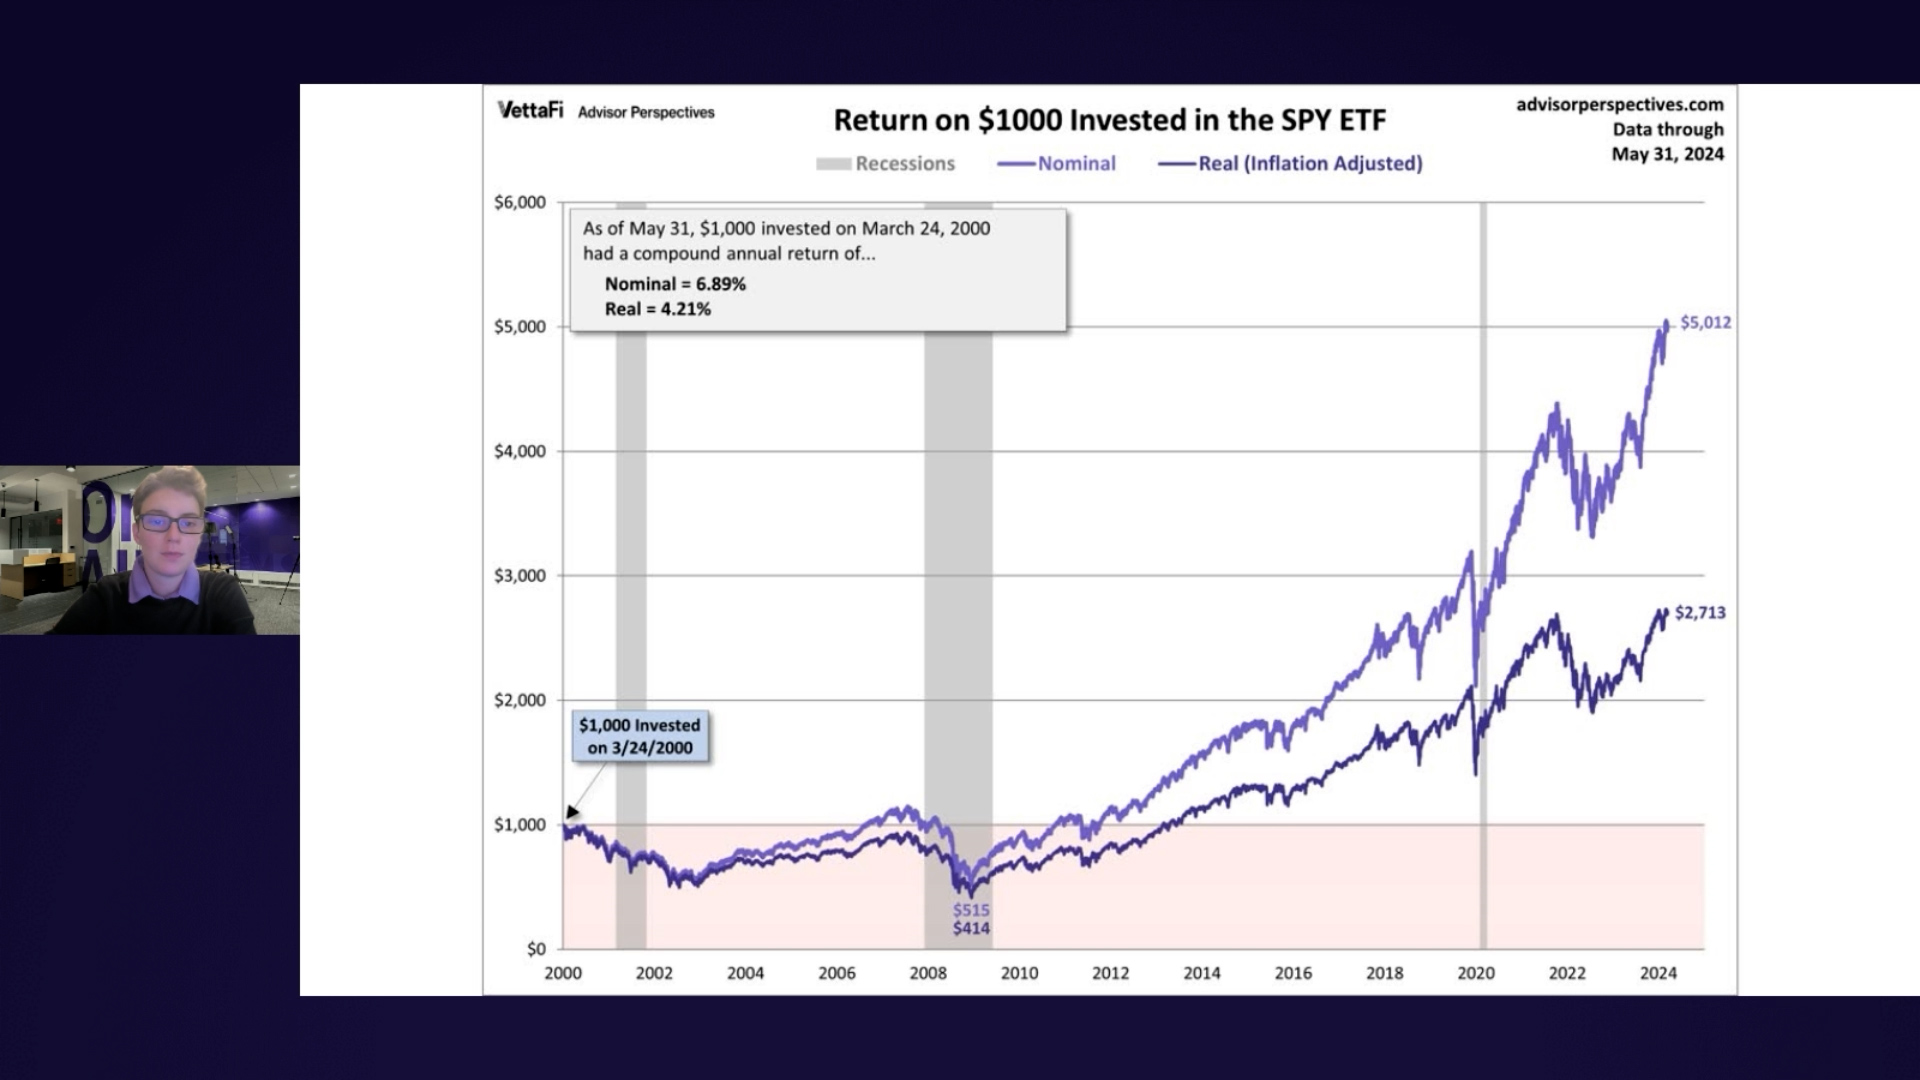
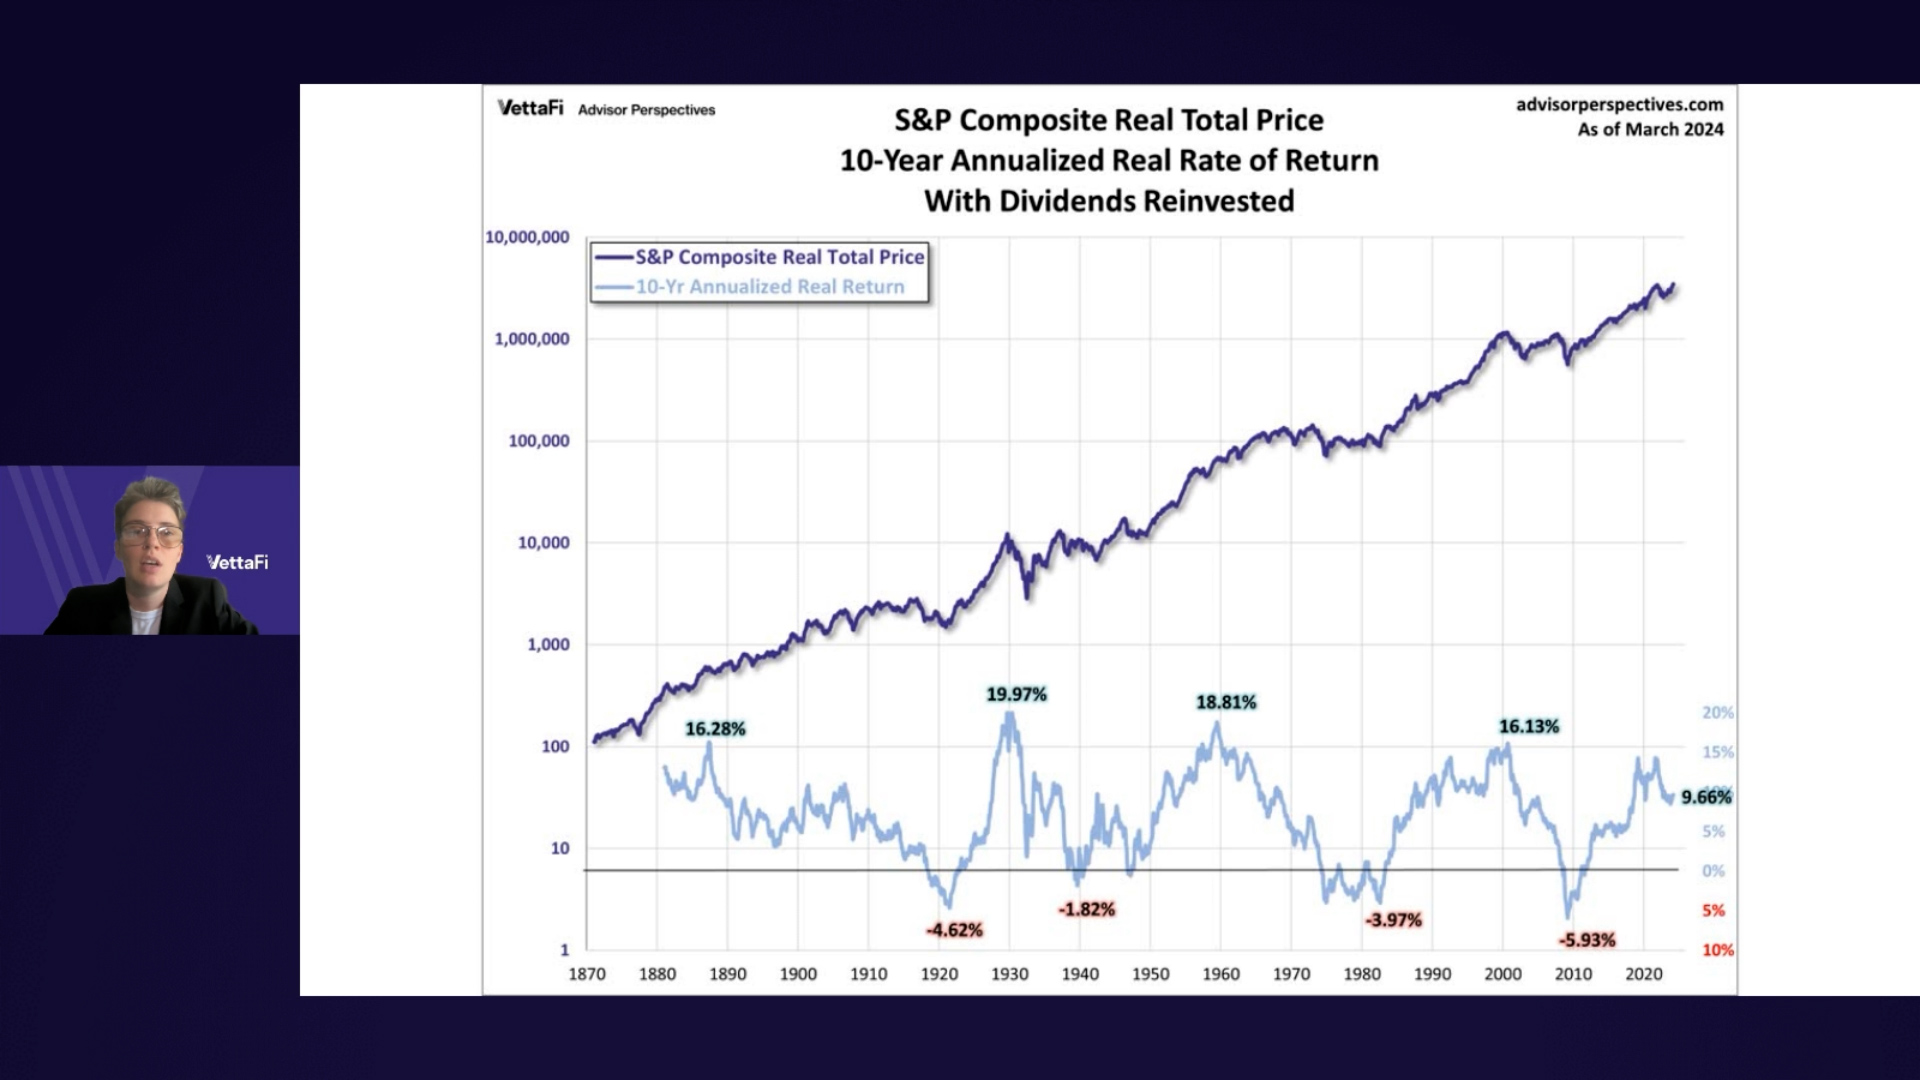
Here's an interesting set of charts that will especially resonate with those of us who follow economic and market cycles. Imagine that five years ago you invested $10,000 in the S&P 500. How much would it be worth today, with dividends reinvested but adjusted for inflation?
The S&P 500 closed March with a monthly gain of 3.10%, after a gain of 5.17% in February. After close on the last day of the month, zero of five Ivy portfolio ETFs are signaling "cash", down from last month's final single "cash" signal.
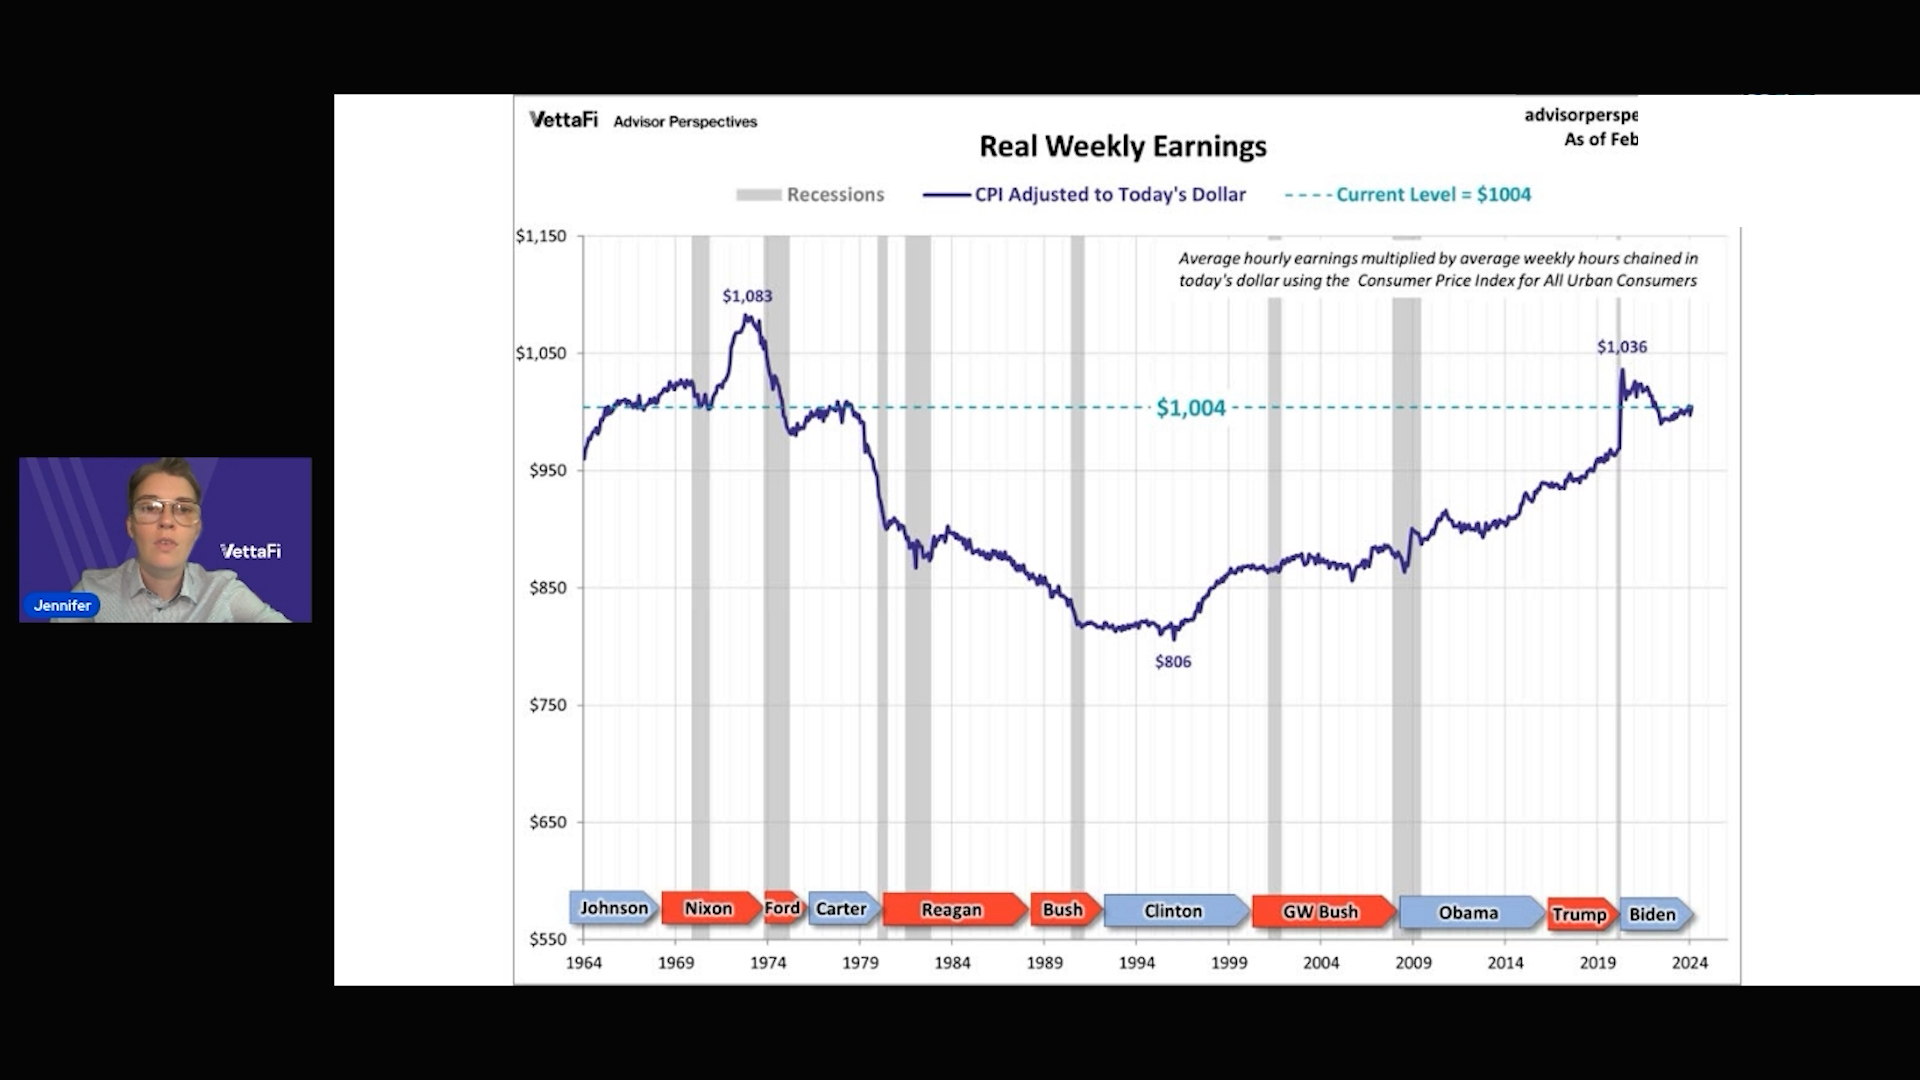
The latest hypothetical real (inflation-adjusted) annual earnings are at $50,210, down 7.3% from over 50 years ago. After adjusting for inflation, hourly earnings are below their all-time high from April 2020.
This week on Charts in Perspective, economic analyst for VettaFi, Jennifer Nash, goes over four key market valuation indicators. Based on the latest S&P 500 monthly data, the market is overvalued somewhere in the range of 89% to 149%, depending on the indicator, up from last month's 82% to 140%.
This is an interview by Robert Huebscher of Woody Brock. They discuss what it means for a nation to "go broke," the tactics a country can use to avoid insolvency, the relevance of the gold standard, and a key finding about sovereign deleveraging and its impact on its standard of living.
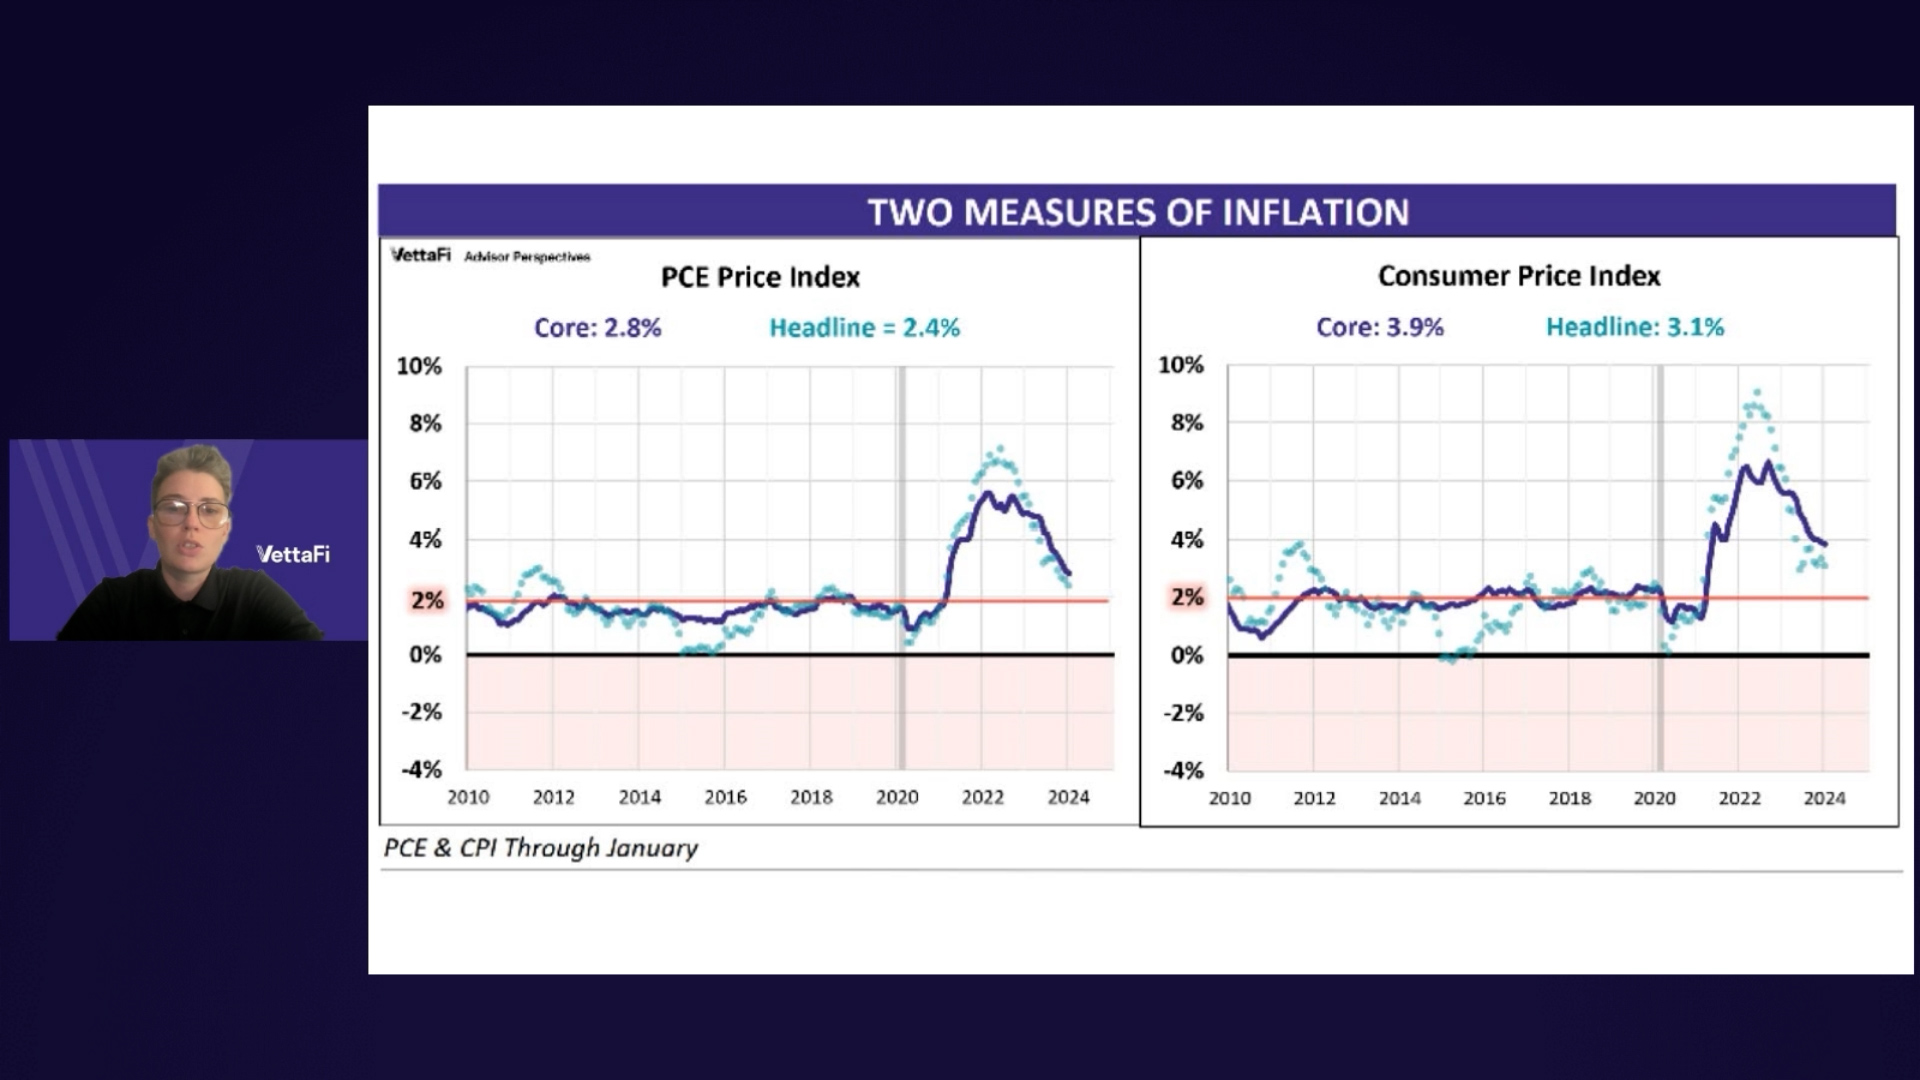
The BEA's core Personal Consumption Expenditures (PCE) Price Index for January shows that core inflation continues to be above the Federal Reserve's 2% long-term target at 2.8%. The January core Consumer Price Index (CPI) release was higher, at 3.8%. The Fed is on record as using core PCE data as its primary inflation gauge. For a closer look at each of those releases, check out our latest Consumer Price Index and PCE Price Index releases.
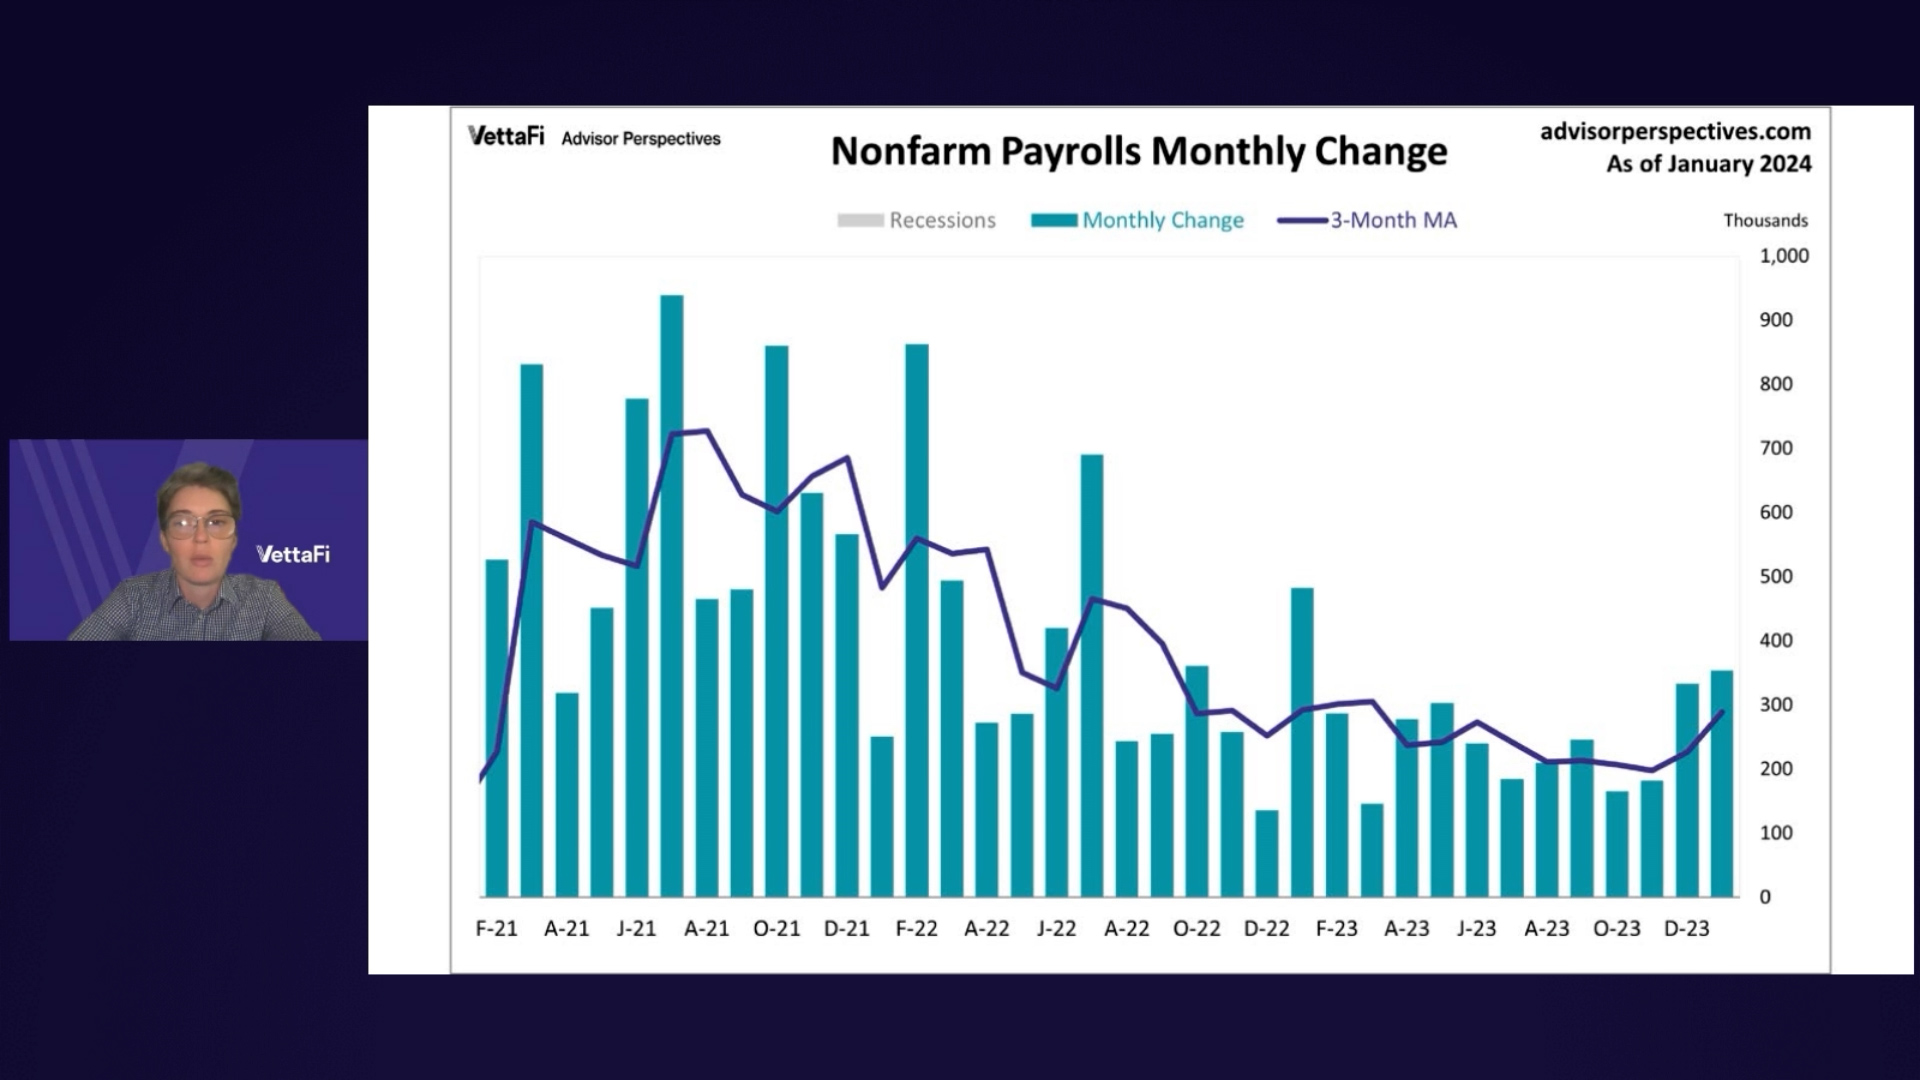
The latest employment report showed 353,000 jobs were added in January, almost twice as much as the expected addition of 187,000 new jobs. Meanwhile, the unemployment rate remained at 3.7%. In this video, economic analyst Jennifer Nash reviews the latest employment report from January while giving her insights into the modern job market.