This video highlights the major economic news from the week of August 11th-15th.
Last week, the S&P 500 had a rally that took it to 3 straight record highs. The momentum cooled as economic data painted a complex picture.
This video examines two key market valuation metrics: the Trailing Twelve-Months (TTM) P/E ratio and the more reliable P/E10 ratio. Using data through July 2025, we explore their differences, historical context, and what they reveal about the current market's valuation.
Read through the major economic news from the week of July 28th-August 1st.
This video highlights the major economic news from the week of July 28th-August 1st.
A strong GDP rebound was quickly overshadowed by a weaker-than-expected jobs report and hotter-than-anticipated inflation.
The Federal Funds Rate (FFR) is the interest rate banks charge each other to borrow money overnight. It's set by the FOMC and is one of the Federal Reserve's primary tools to implement monetary policy and is a key driver of economic activity. This video examines the Federal Funds Rate and reviews the Fed's interest rate meeting on July 30, 2025.
Now that we're more than halfway through 2025, let's take a look at the top 10 most-read charts so far for the year.
This video examines the top 10 most-read charts for the first half of the year. From market updates and valuations to consumer attitudes and gas prices, these charts have provided crucial insights into the economic landscape that has shaped the first six months of 2025.
Market valuation indicators are used by investors and analysts to gauge whether markets are overvalued, undervalued, or fairly valued relative to historical norms. This video examines four market valuation indicators to assess the current market's valuation with data through June 2025.
This video examines and compares the two main measures of inflation: the Personal Consumption Expenditures (PCE) Price Index and the Consumer Price Index, with data through May 2025.
Last week, the U.S. labor market took center stage, delivering conflicting signals. The S&P 500 reached many record highs during the shortened trading week.
Last week's economic data presented a mixed picture, emerging against the backdrop of a record market rally and rising inflation.
The Federal Funds Rate (FFR) is the interest rate banks charge each other to borrow money overnight. It's set by the FOMC and is one of the Federal Reserve's primary tools to implement monetary policy and is a key driver of economic activity. This video examines the Federal Funds Rate and reviews the Fed's latest interest rate meeting.
When we think of the U.S. government's finances, we often focus on the massive debt. But what about Uncle Sam's assets? This video provides an update on the Fed's Financial Assets through Q1 2025
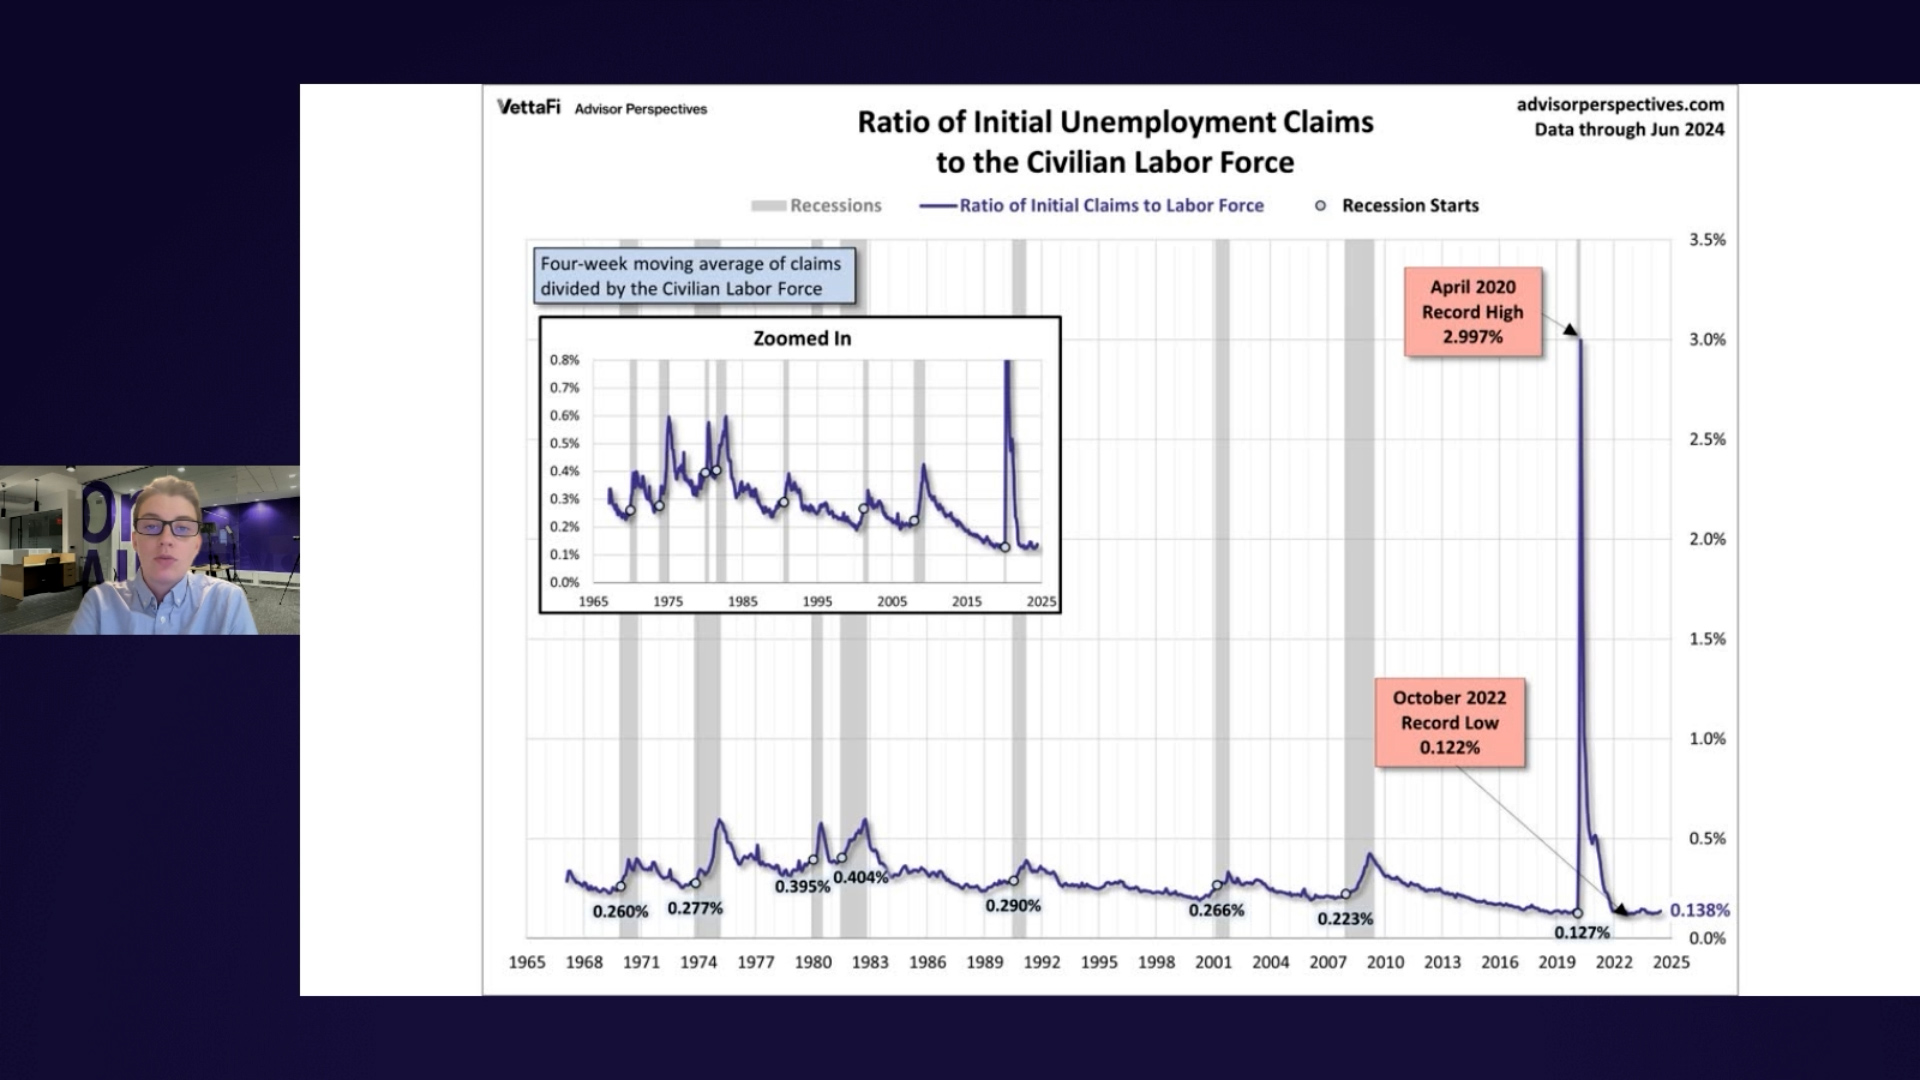
This video examines the ratio of unemployment claims to the civilian labor force and its effectiveness as a recession indicator.
Last week, the labor market took center stage, presenting a nuanced picture of continued resilience alongside subtle signs of softening.
The Buffett Indicator, made popular by Warren Buffett, assesses the overall value of the stock market relative to the economy. This video provides the May 2025 update on Buffett Valuation Indicator.
Margin debt is the amount of money an investor borrows from their broker via a margin account. This video provides an update on FINRA's margin debt with data through April 2025.
While April brought further welcome news on the inflation front, underlying consumer fundamentals painted a more concerning picture.
Explore the performance journey of the S&P 500, Nasdaq, and Dow Jones since their peaks in 2000. This video analyzes how these key U.S. stock market indexes have navigated over two decades of economic shifts and technological change, revealing their distinct paths through April 2025.
This video provides an update on the monthly moving averages we track for the S&P 500 and the Ivy Portfolio after the close of the last business day of the month.
Margin debt is the amount of money an investor borrows from their broker via a margin account. Margin debt is often seen as a measure of investor sentiment and risk appetite. High levels of margin debt can signal confidence, but extreme spikes may also indicate excessive speculation, increasing the risk of market instability.
Inflation affects everything from grocery bills to rent, making the Consumer Price Index one of the most closely watched economic indicators. What does inflation mean at the micro level — specifically to your household?
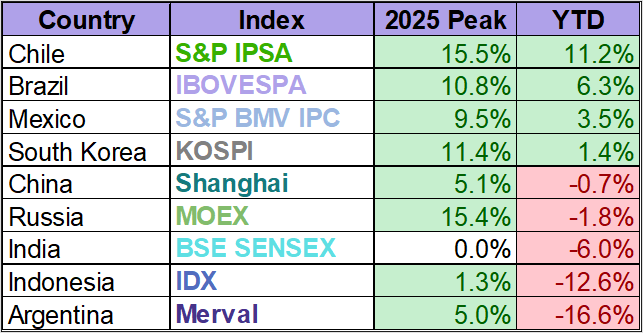
Four of the nine indexes on our emerging markets watch list have posted gains through April 11, 2025. Chile's IPSA is in the top spot with a year to date gain of 11.2%. Brazil's IBOVESPA is in second with a year to date gain of 6.3% while Mexico's BMV IPC is in third with a year to date gain of 3.5%.
When we think of the U.S. government's finances, we often focus on the massive debt. But what about the assets? What does Uncle Sam actually own, and which asset is the largest?
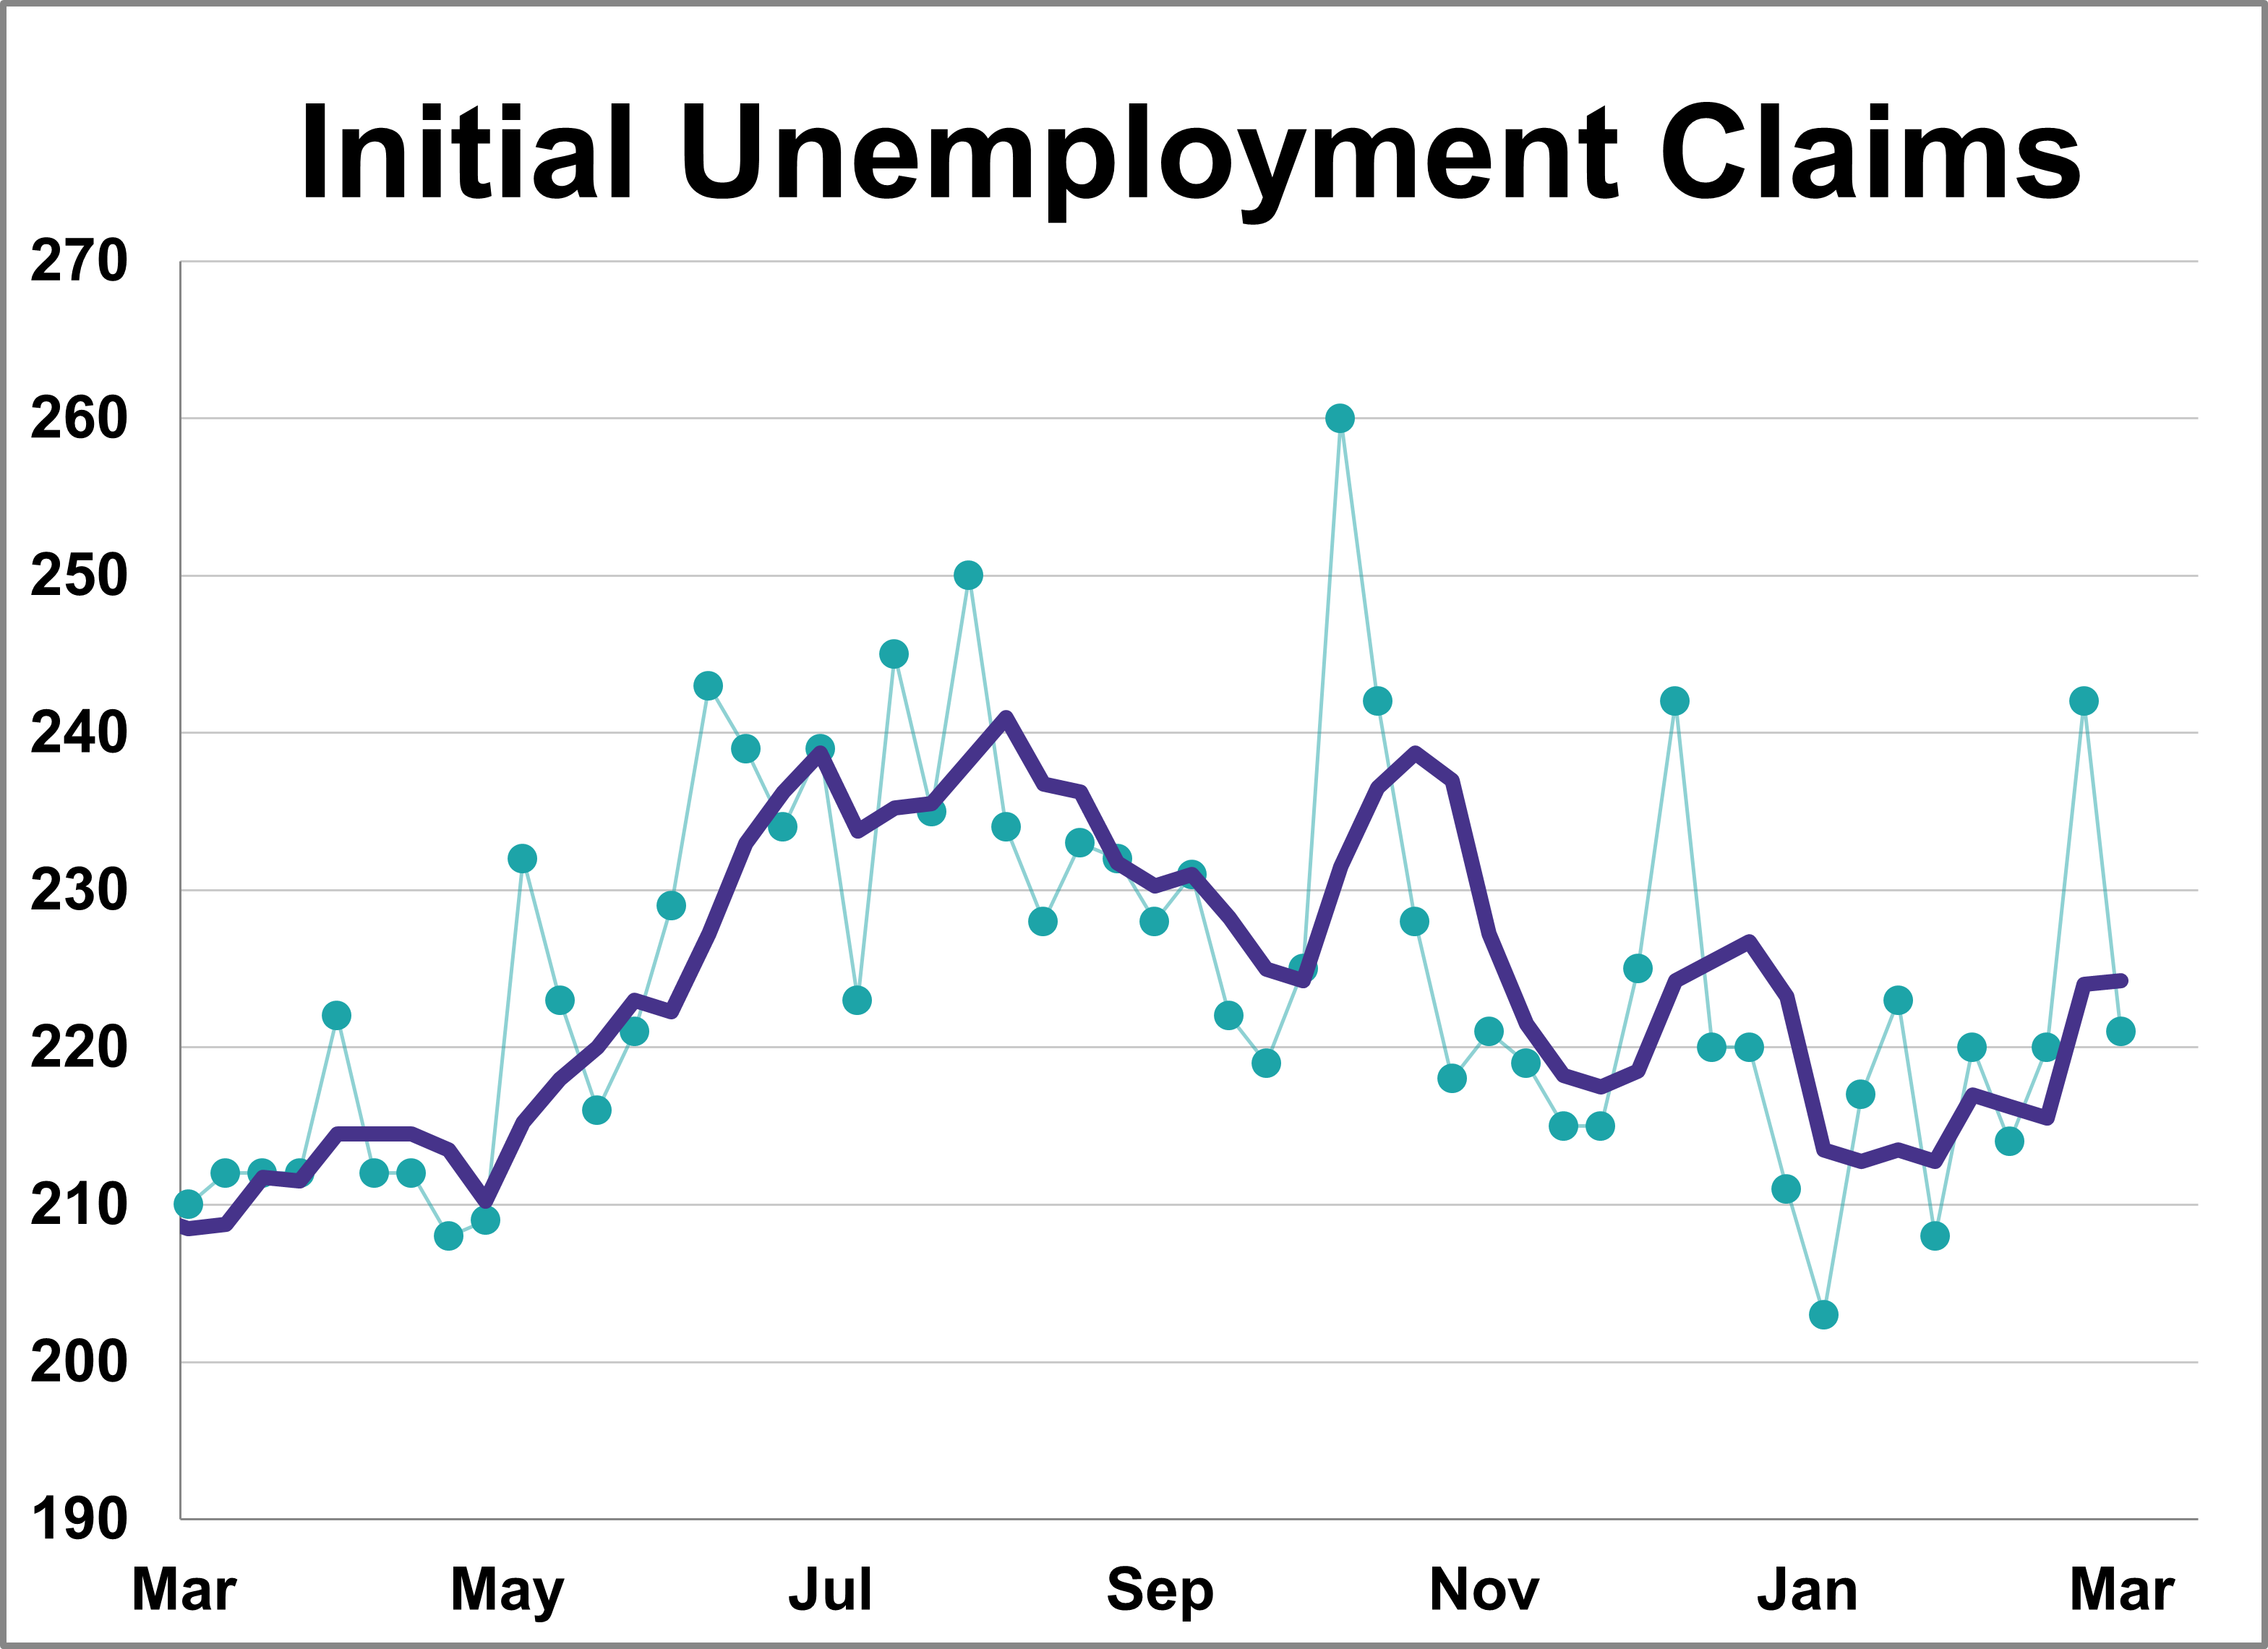
In the week ending March 1st, initial jobless claims were at a seasonally adjusted level of 221,000. This represents a decrease of 21,000 from the previous week's figure. The latest reading was lower than the 234,000 forecast.
The Ivy Portfolio is based on the asset allocation strategy used by endowment funds from Harvard and Yale. It is an equally weighted portfolio constructed with 5 ETFs that feature a mix of different asset classes. By allocating across different asset classes, diversification is achieved, and risk is reduced.
A few months ago, the Census Bureau released its annual report on household income data for 2023. During 2023, the median (middle) average household income rose 8.0% to $80,730. Let's take a closer look at the quintile averages, which dates from 1967, along with the statistics for the top 5%.
This chart series features an overlay of the Four Bad Bears in U.S. history since the equity market peak in 1929. The numbers are through the December 31, 2024 close. These charts are not intended as a forecast but rather as a way to study the current market in relation to historic market cycles.
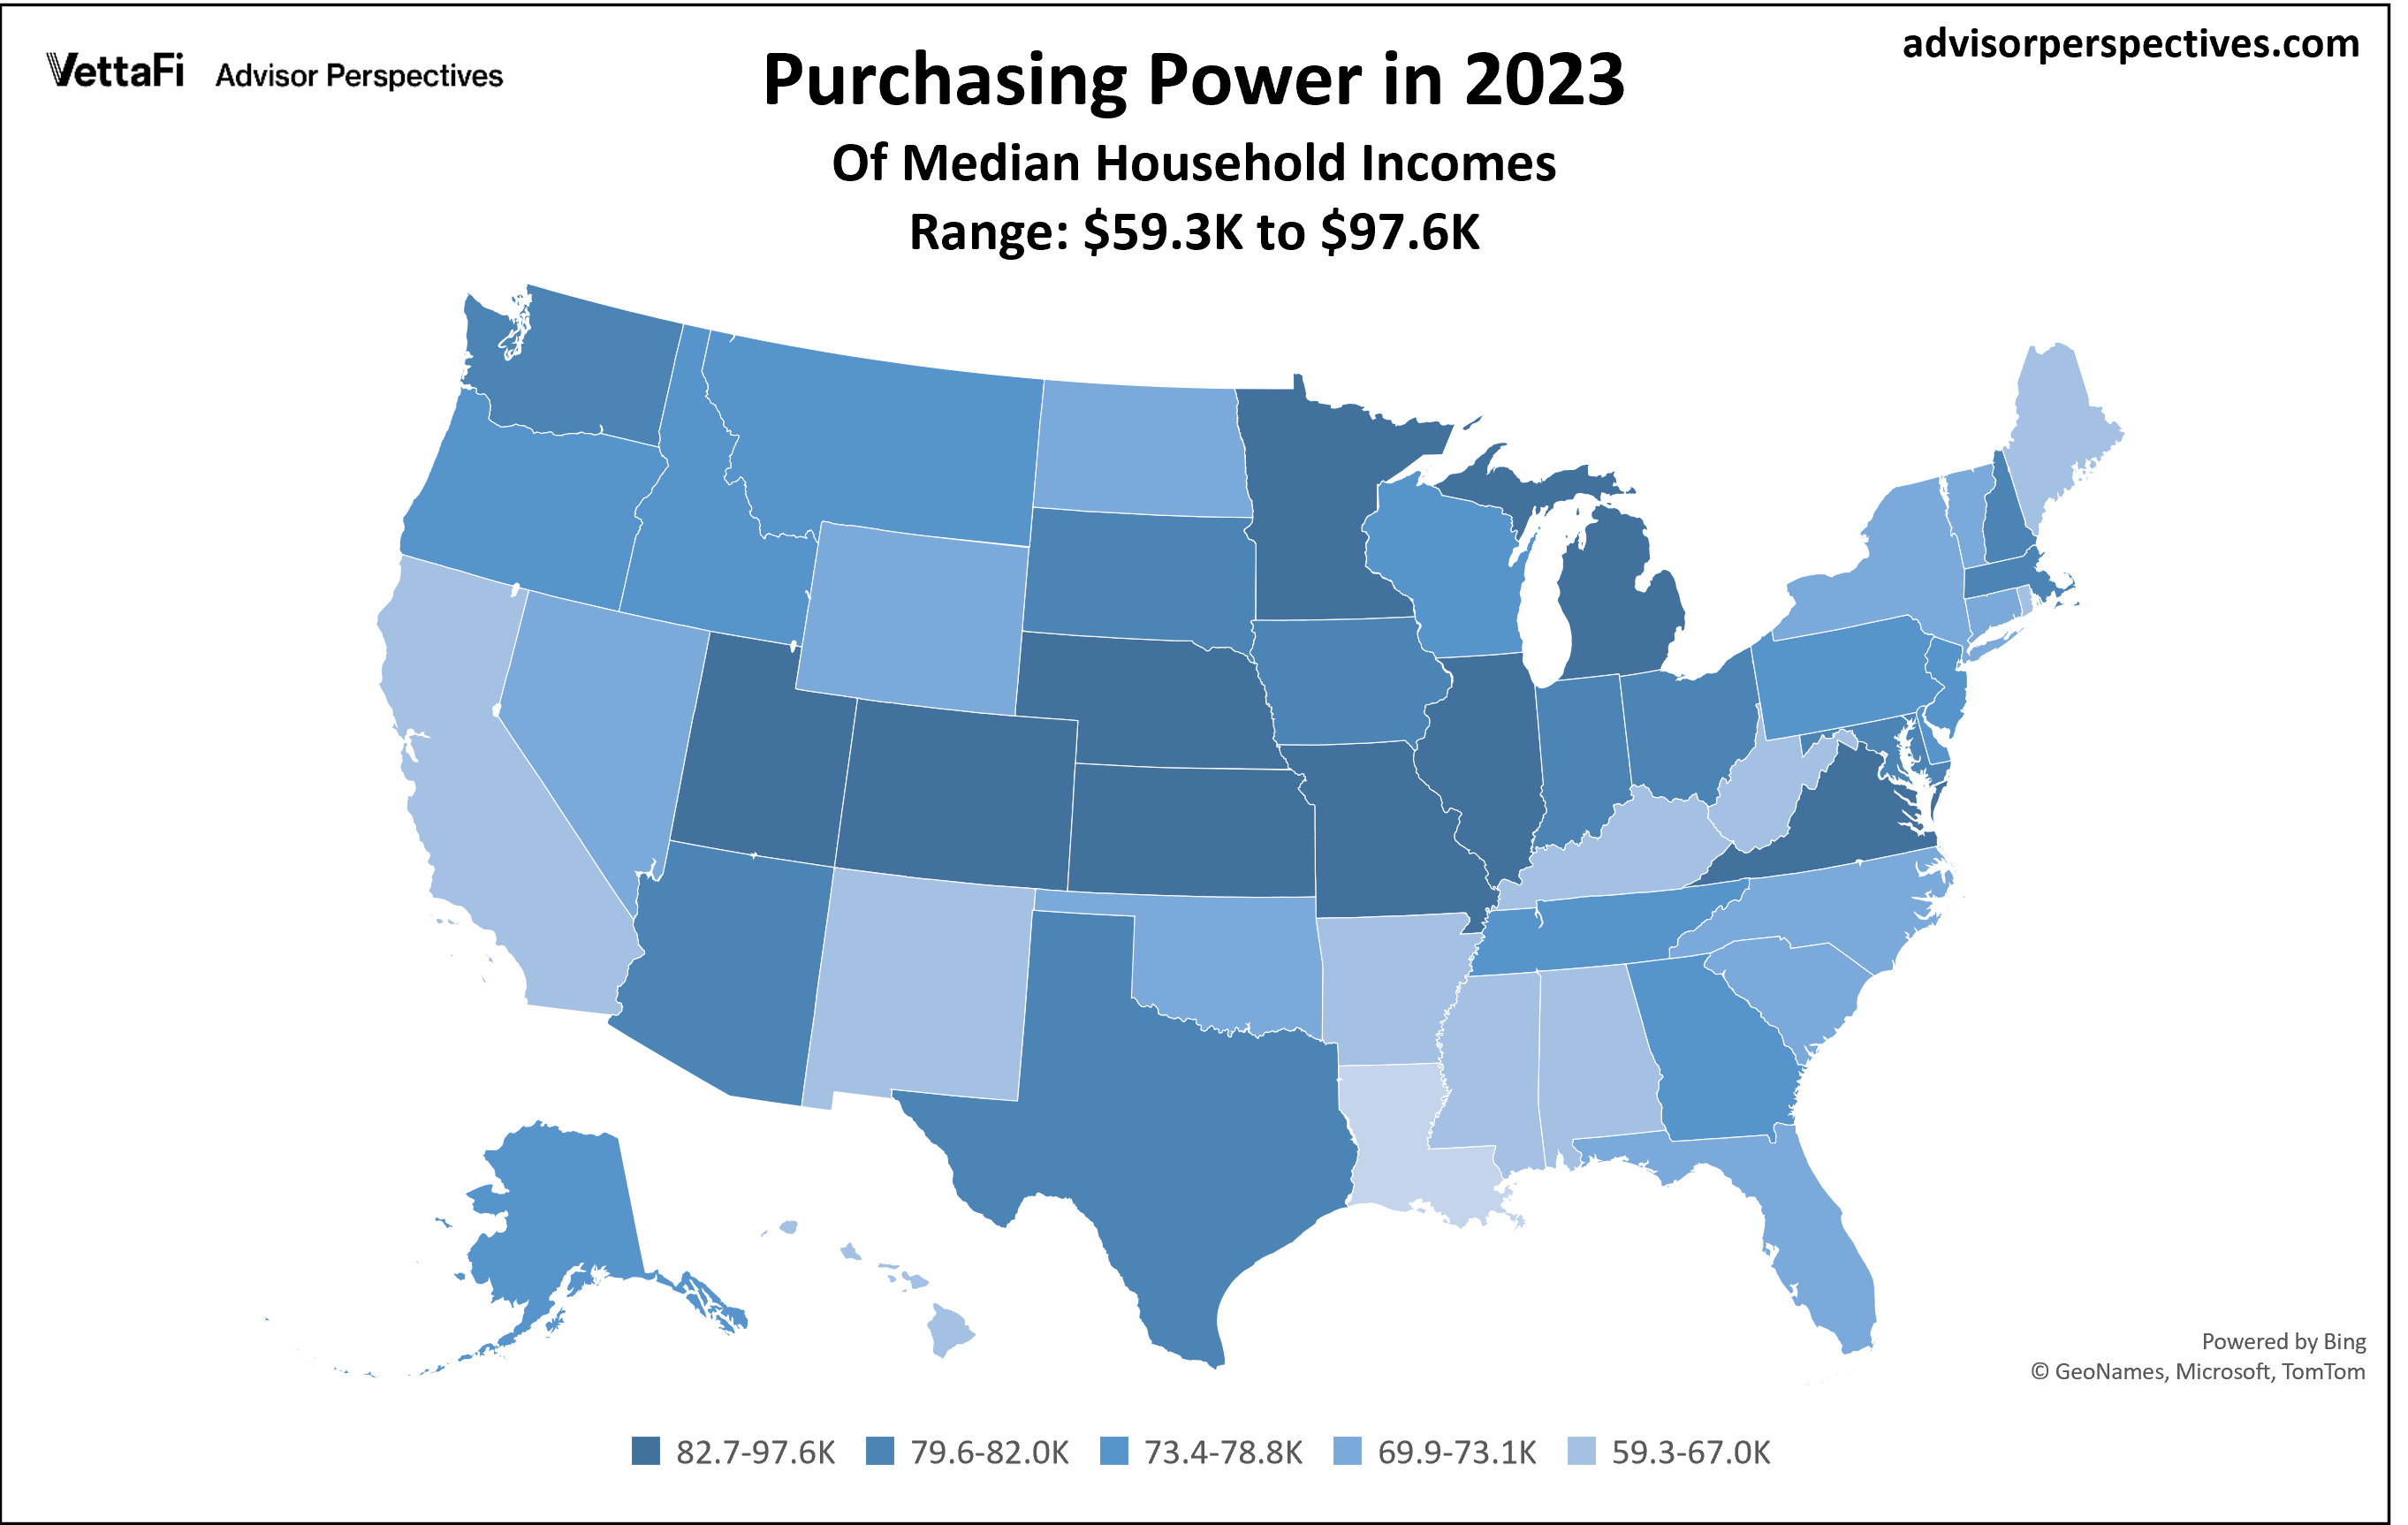
Earlier this week we posted an update on the median household income for the 50 states and DC which includes annual data from 1984 to 2023. Let's now look at the actual purchasing power of those median incomes. For this adjustment, we're using the "C2ER Cost of Living Index" produced by C2ER, the Council for Community and Economic Research.
In the week ending January 4th, initial jobless claims fell to their lowest level since February 2024. Initial jobless claims were at a seasonally adjusted level of 201,000, a decrease of 10,000 from the previous week's figure. The latest reading was better than the 214,000 forecast.
With 2024 behind us, let's revisit the top 10 most-read charts of the year.
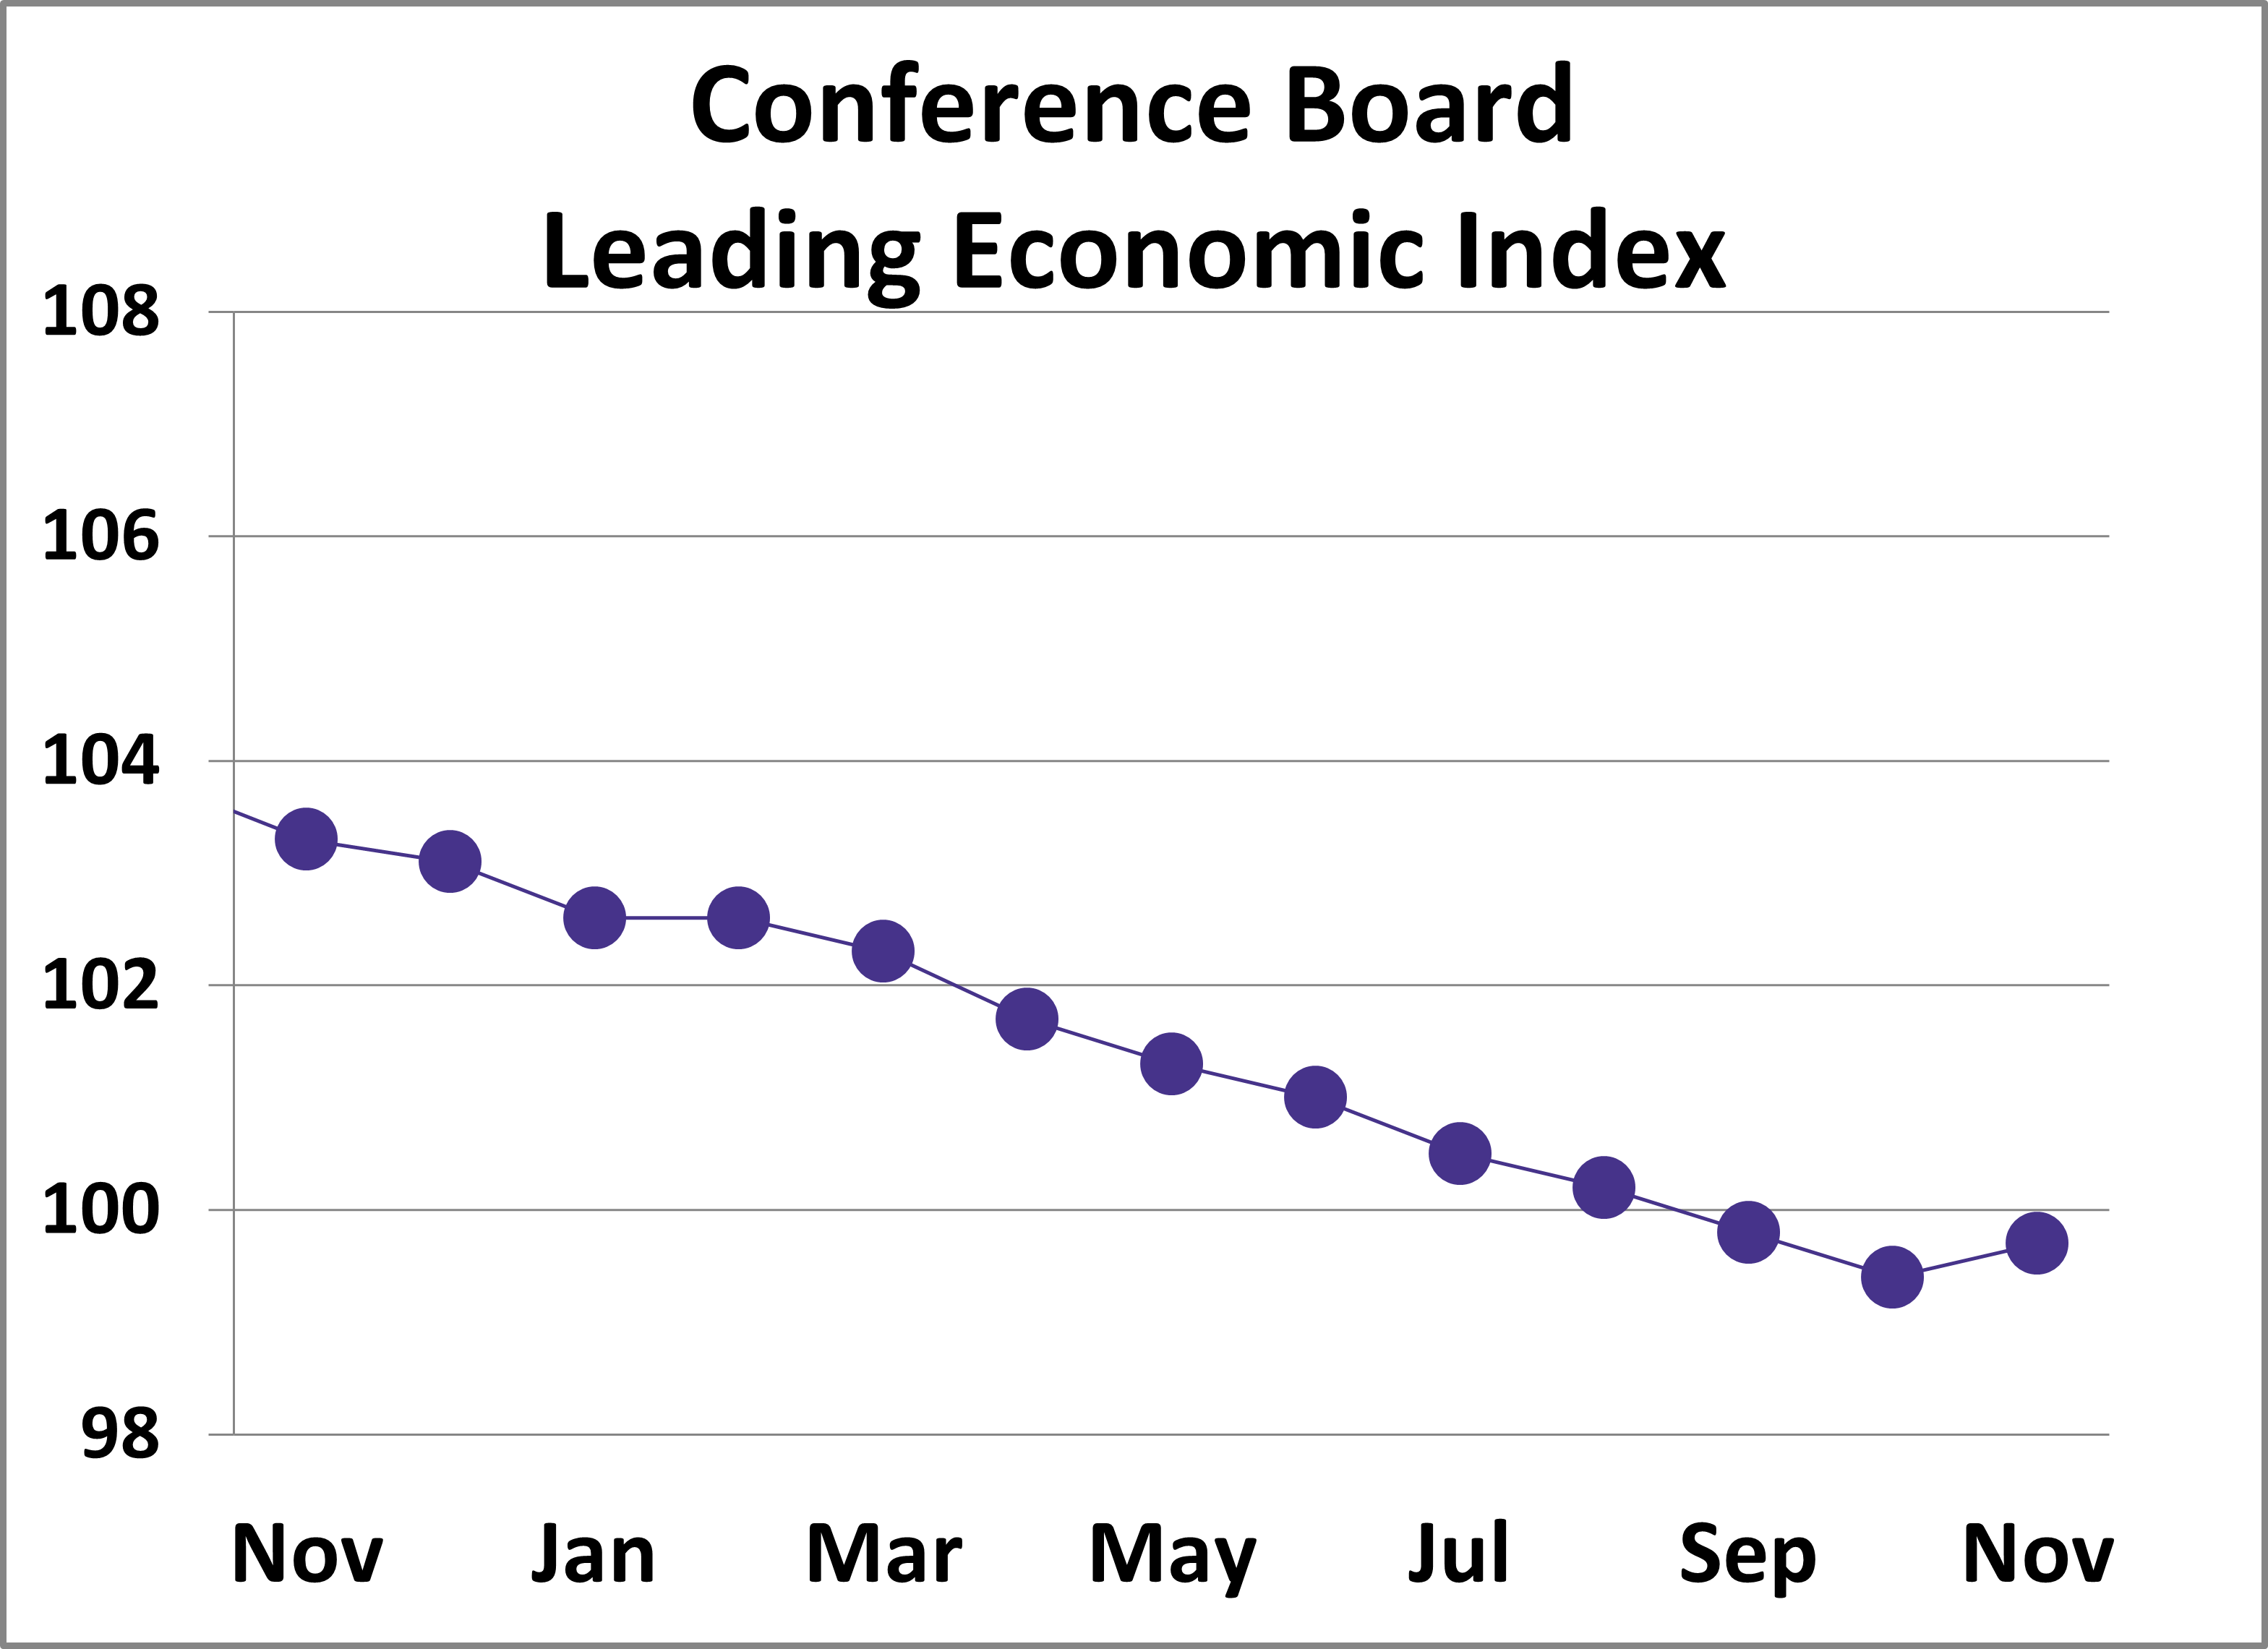
The Conference Board Leading Economic Index (LEI) increased slightly in November. The index rose 0.3% from the previous month to 99.7 after eight consecutive monthly declines.
Economic indicators provide insight into the overall health and performance of an economy. They are essential tools for policymakers, advisors, investors, and businesses because they allow them to make informed decisions regarding business strategies and financial markets. In the week ending on August 15th, the SPDR S&P 500 ETF Trust (SPY) rose 0.14% while the Invesco S&P 500® Equal Weight ETF (RSP) was up 2.45%.
Economic indicators are released every week to provide insight into the overall health and performance of an economy.
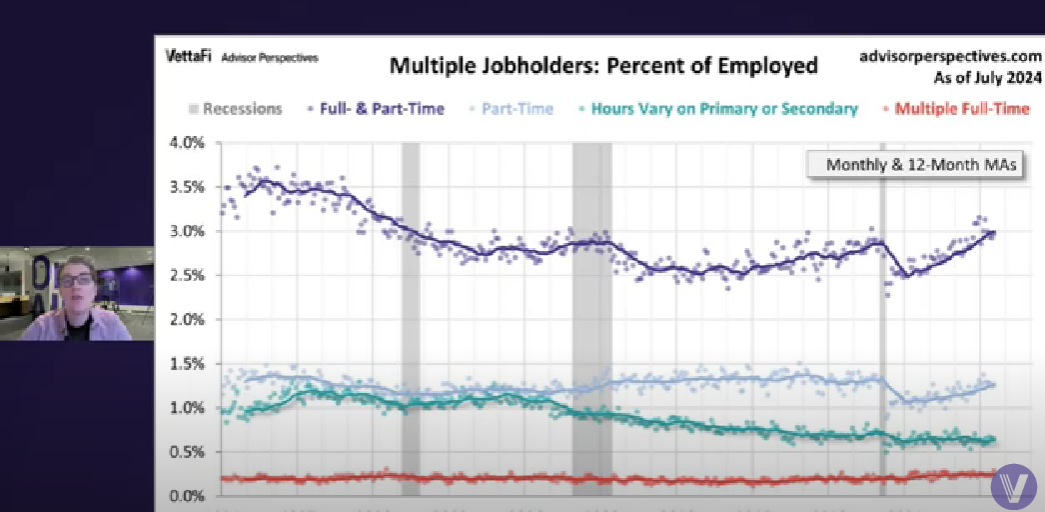
What are the long-term trends for multiple jobholders in the US? The Bureau of Labor Statistics has three decades of historical data to enlighten us on that topic, courtesy of table A-16 in the monthly Current Population Survey of households.
Official recession calls are the responsibility of the NBER Business Cycle Dating Committee, which is understandably vague about the specific indicators on which they base their decisions. This committee statement is about as close as they get to identifying their method.
The RecessionAlert weekly leading economic index (WLEI) is a composite for the U.S economy that draws from over 20 time-series and groups them into the following six broad categories which are then used to construct an equally weighted average.
In this article, we look at three indicators from the past week: retail sales, industrial production, and the Conference Board’s Leading Economic Index (LEI). At first, these indicators might seem unrelated. However, they all have a role in predicting economic trends.
Advisor Perspectives, a leading publisher and ranked as the #1 eNewsletter for financial advisors by the Erdos & Morgan “FAMOUS” Study (2019-2023) has announced its Venerated Voices™ awards for commentaries published in Q2 2024.
The S&P 500 posted a near-perfect week, with gains every day except Thursday.
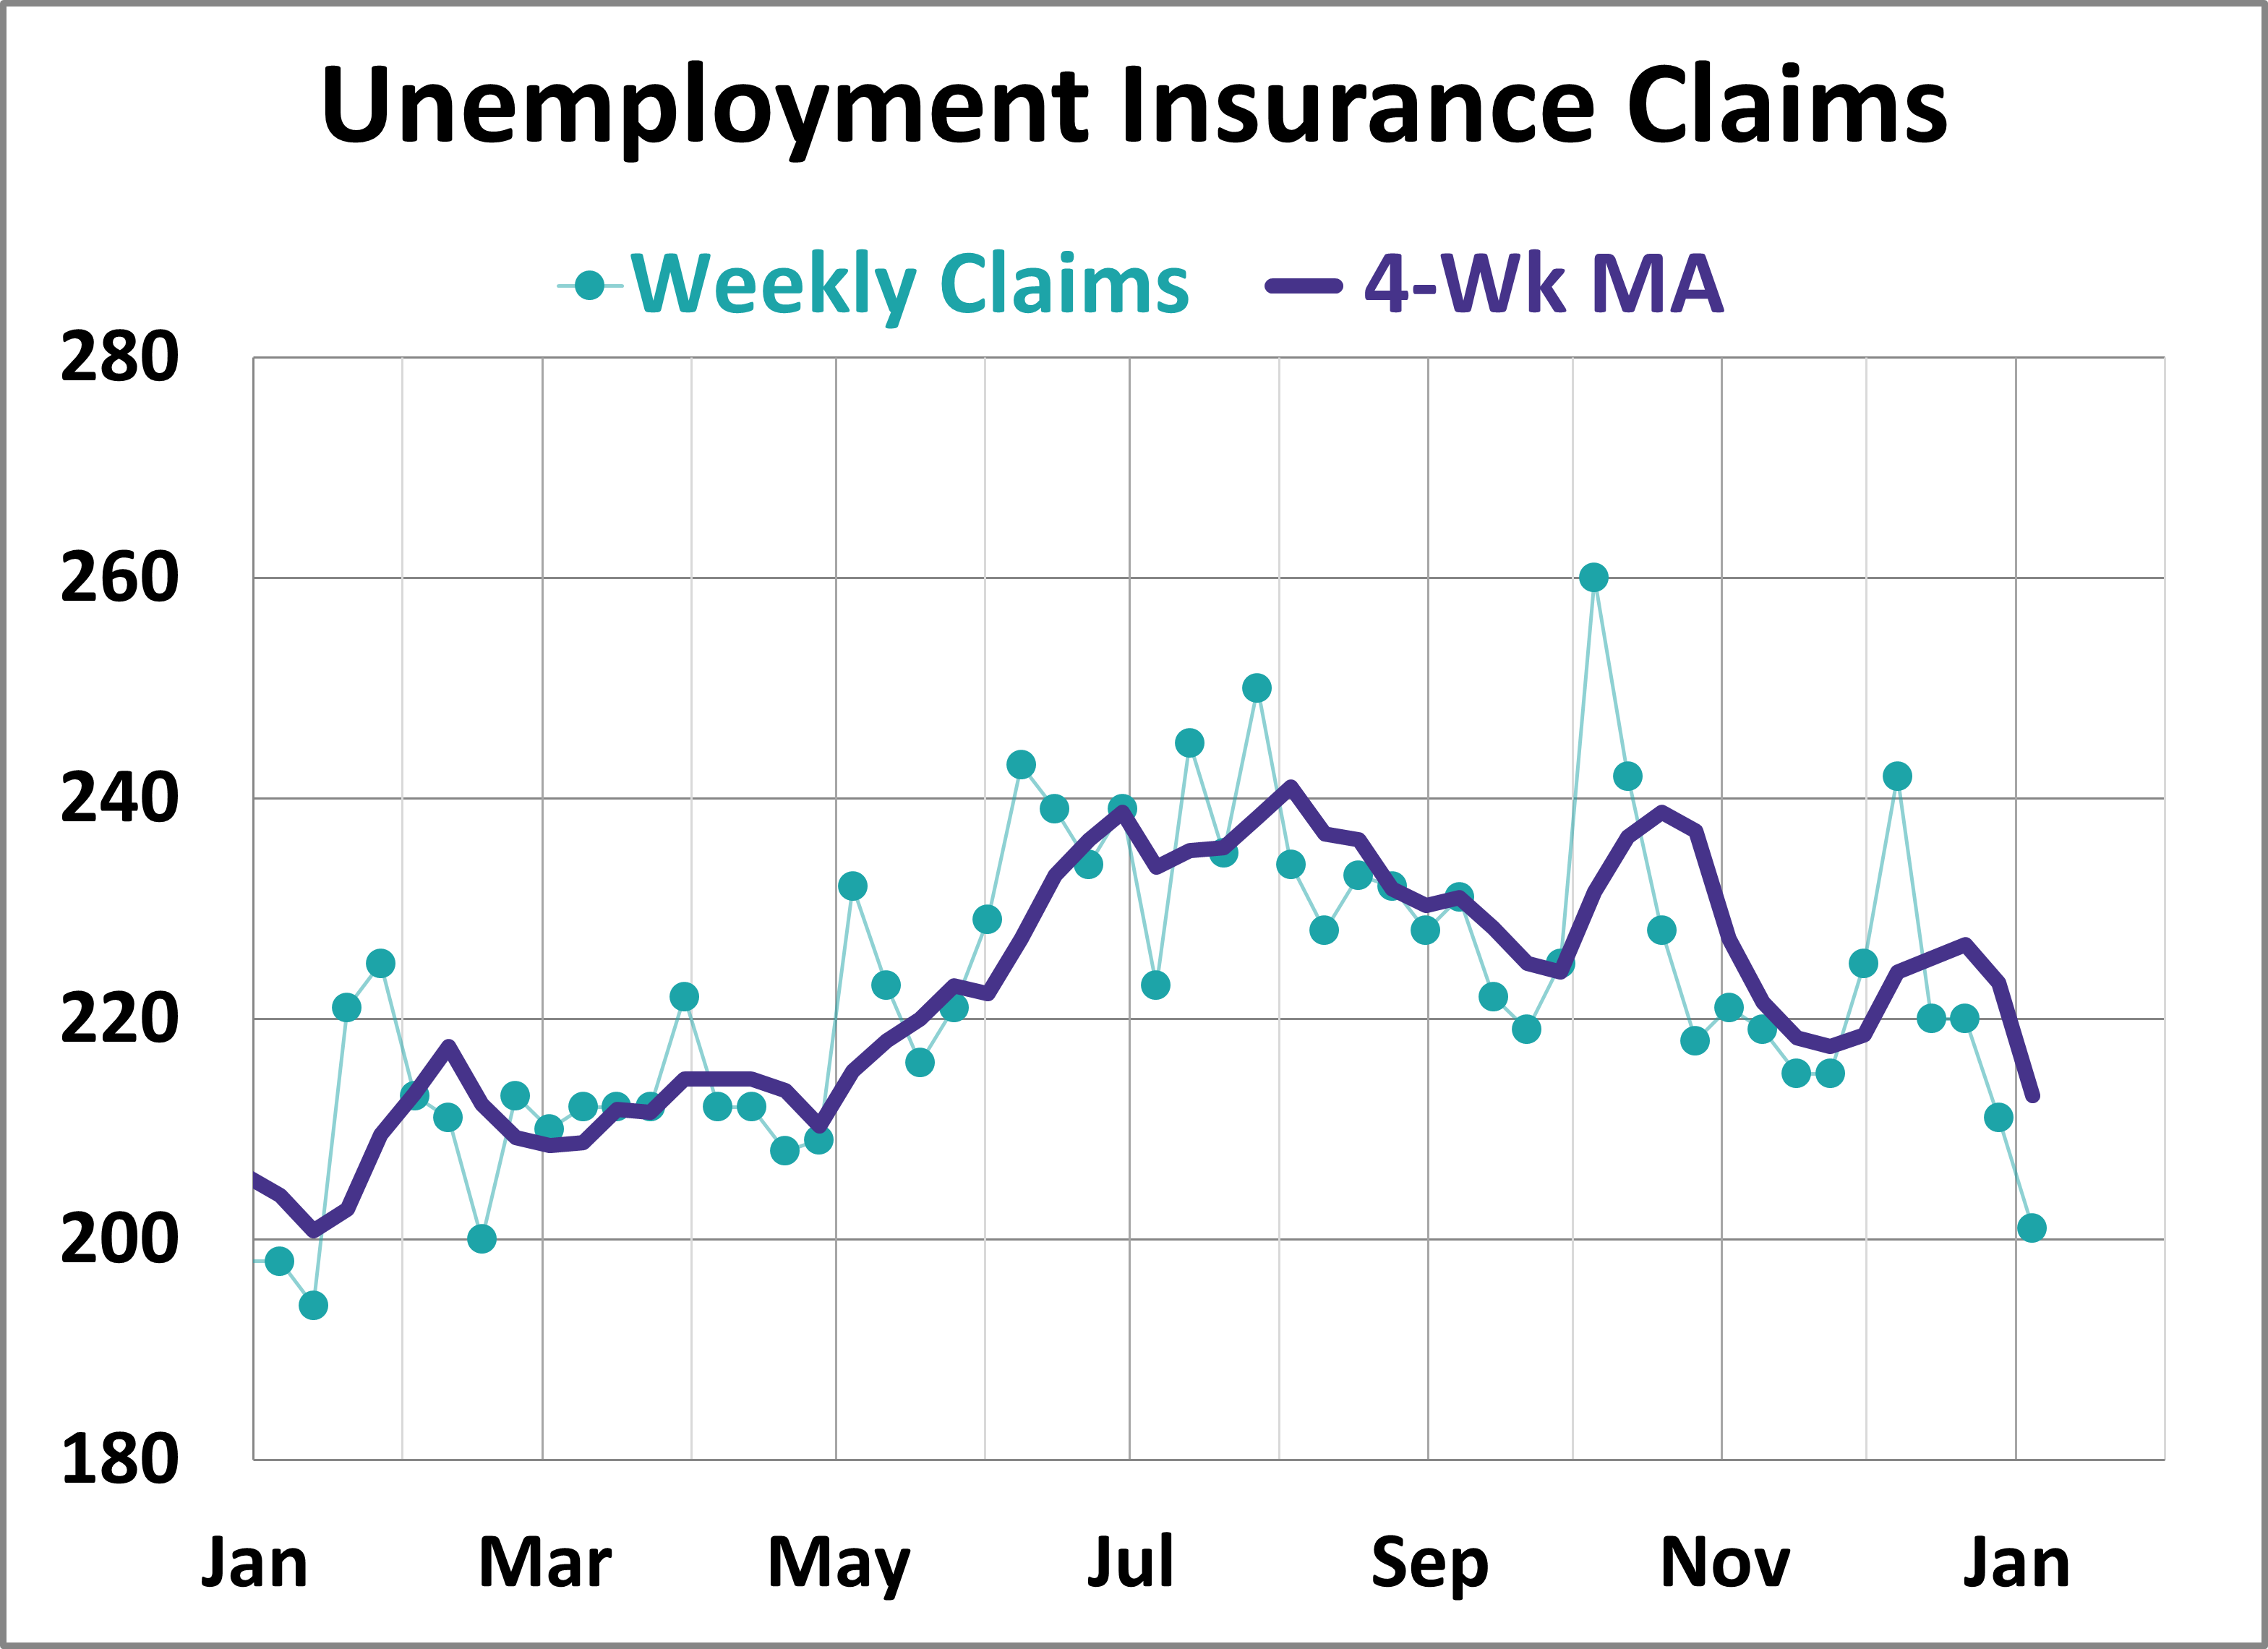
Every week I post an update on new unemployment claims shortly after the BLS report is made available. Our focus is the four-week moving average of this rather volatile indicator. The financial press generally takes a fairly simplistic view of the latest number, and the market often reacts, for a few minutes or a few hours, to the initial estimate, which is always revised the following week.
In the week ending on June 3, the SPDR S&P 500 ETF Trust (SPY) rose 1.09% while the Invesco S&P 500® Equal Weight ETF (RSP) was down 0.13%.
A bull market occurs when stocks are rising, the economy is expanding, and there is overall optimism towards market conditions. On the contrary, a bear market occurs when stock prices are falling, the economy is contracting, and there is overall pessimism towards market conditions. There are a handful of theories as to where the "bear" and "bull" names originated from for describing the stock market but the one that I find the most helpful is that they are derived from the way the animals attack their opponents. A bull thrusts its horns up in the air; a bear swipes its paws down.