The current level of stock market valuations remains – easily – the most speculative extreme in U.S. financial history, beyond both the 1929 and 2000 extremes. Our baseline estimate is that the S&P 500 has a material risk of losing something on the order of 75% over the completion of this cycle.
The essential feature of a useful alternative asset isn’t that it’s unusual or exotic, but that its returns aren’t tightly linked to the risks that already dominate the portfolio. The value of an alternative asset comes from the way it interacts with the other assets in the portfolio.
What to do? Does one capitulate and chase the bubble at the highest valuations in history? Does one wring their hands at the prospect of a bubble that might only go higher and higher forever without end? My hope is that this month’s comment will offer both perspective and confidence that it is not necessary to chase current extremes, nor to be anxious even about the possibility of steeper ones.
The defining feature of a Ponzi scheme is that it persuades investors to pay for future cash flows that, at least in part, don’t actually exist, while creating the impression that those cash flows imply an attractive return on the price investors pay. If we look carefully at the record valuation extremes in the equity market, and the wildly elevated profit margins that investors appear to view as permanent, we can already see the potential for difficult, even tragic outcomes for investors.
In elevated financial markets, risk is rarely eliminated. It is usually only relocated. During the run-up to the 2008 financial crisis, mortgage risk did not disappear. It was transformed, repackaged, and spread across the system in ways that made it appear safer than it was.
The word 'equilibrium' is an invitation to recognize that nothing exists by itself, alone. Subject and object are two sides of the same coin – their interaction is a single phenomenon. That perspective can offer a great deal of insight about economics, financial markets, speculative bubbles, passive investing, and nearly everything in existence.
To love a bubble but hate a crash is to misunderstand the market. A bubble is a crash on its way to becoming. A crash is a bull market on its way to becoming. All we can do is to accept, and as difficult as it may be – embrace – whatever form we have in the present moment, so we can do our best with each of them.
As political pressure on the Federal Reserve intensifies and markets ponder the nomination of a new Chair, understanding this chain of risk is increasingly important for investors. Equity valuations are heavily affected by expectations for long-term cash flows, along with the interest rates and risk-premiums that drive how much investors are willing to pay for those future dollars.
The defining feature of every bubble is the same: a growing inconsistency between the long-term returns that investors expect in their heads - based on extrapolation of the past, and the long-term returns that properly relate prices to likely future cash flows - based on valuations. Every bubble smuggles the same tragic past into the same tragic future by packaging it with new wrinkles that convince investors that this time is different. Ultimately, they still end the same way.
With the federal government open after its longest shutdown on record, we will soon get a clear indication of how payrolls fared in September and October.
As I detailed in August, our most reliable valuation measures – based on their relationship with actual subsequent S&P 500 total returns across a century of market history – suggest that the expectations of investors for long-term market returns are wildly misaligned with the returns implied by discounted cash flows.
Division by zero is known as a “singularity.” It’s the point where equations break down, values become “indeterminate,” things stop working normally, and variables shoot toward infinity and suddenly collapse on the other side.
The word “bubble” gets tossed around quite a bit. Usually, it comes in the form of verbal arguments about whether prices have advanced to a point that’s “too high” in some sense. We can do much better than that. A bubble is a mathematical object.
With our most reliable stock market valuation measures at the highest extremes in U.S. history, it’s useful for investors to remember that a market crash is nothing but risk-aversion meeting a market that is not priced to tolerate risk.
When investors approach the financial markets, there’s a tendency to imagine that conditions can be judged as favorable or unfavorable based on one single measure or another. The fact is that market conditions at any moment in time are a composite of interdependent forces.
While we remain open to changes in market conditions, as well as periodic “fast, furious, prone-to-failure” advances that can relieve the oversold “compression” produced by market losses, we are presently on high alert for a possibly abrupt and cascading market and economic dislocation in the weeks ahead.
The stock market faces severe downside risk ahead, and the U.S. is constrained in the unsystematic monetary and fiscal expansion that both amplified that bubble and fueled record but wholly impermanent corporate profit margins. Meanwhile, the U.S. economy now faces an imminent recession, and if we fail to be vigilant, we, once united Americans, risk losing what is far greater and more valuable than money.
One of the biggest challenges investors face today is navigating the most concentrated U.S. stock market in history, where the largest stocks represent a record share of total market value.
With our most reliable valuation measures more extreme than both the 1929 and 2000 market peaks, we continue to believe that the stock market is tracing out the extended peak of the third great speculative bubble in U.S. history.
The strong performance of large-cap stocks over the past decade has left the market exceptionally top-heavy. By some measures, stock market capitalization has never been more concentrated among a handful of large stocks as today.
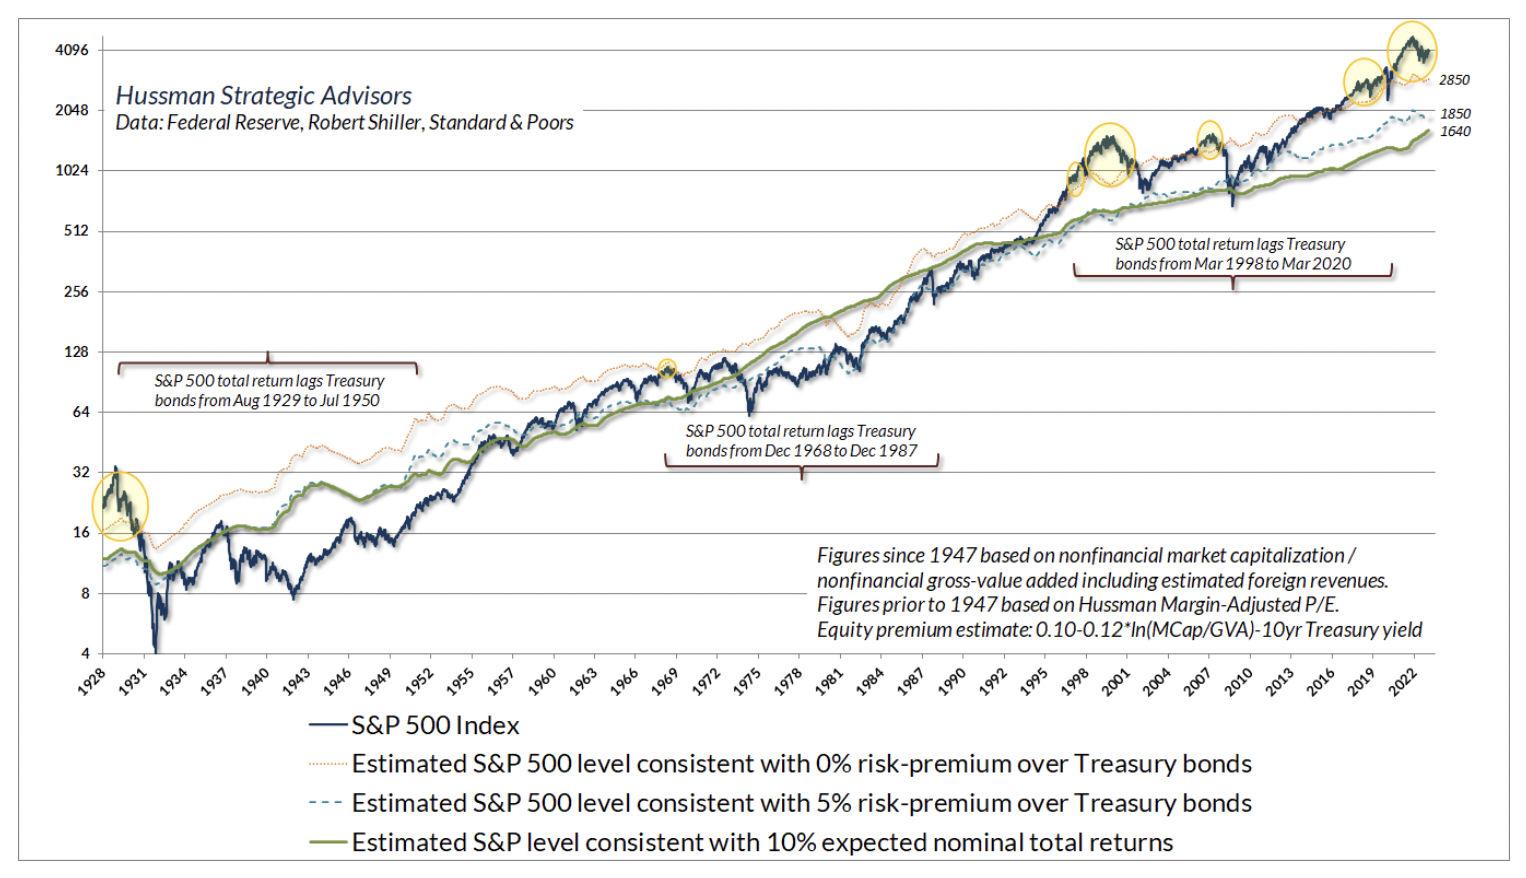
On December 6, the S&P 500 set the most extreme level of valuations on record, exceeding both the 1929 and 2000 market peaks on measures that we find best-correlated with actual, subsequent 10-12 year S&P 500 total returns across a century of market cycles.
On Friday December 6th, the U.S. stock market pushed to the most extreme level of valuation in U.S. history
Change is the sum of fundamental trends, the gradual elimination of accumulated extremes, and the random arrival of new shocks.
One of most dangerous habits of a speculative crowd is the tendency to use unconditional averages and unconditional probabilities regardless of how extreme market conditions have become. This is like stepping into a house with two rooms, one with the temperature at 0 degrees and one at 140 degrees, and expecting a temperature of 70 either way.
On September 18, the Federal Reserve cut the Federal funds rate, as expected, announcing at the same time that the Fed will continue to reduce its balance sheet. In my view, both of these decisions were appropriate. The Fed reduced short-term rates by 50 basis points, which was consistent with economic conditions that remain near the threshold of recession.
When you see that behavior at extreme valuations, it tends to be a sign of underlying skittishness and risk aversion. When valuations are setting record extremes because the news can’t get any better, even a slightly less optimistic outlook becomes a risk.
During each speculative run-up in asset prices – whether the dot-com bubble, the housing bubble, or more recently the rapid rise (and fall) of the stocks of electric vehicle companies – there’s typically a moment when Wall Street strategists, analysts, and investors go all-in on that theme.
The stock market is not a balloon that gets bigger when money “flows into” it. It doesn’t get smaller because money “flows out” of it. Holding the number of shares constant, the stock market gets bigger if investors pay a higher price for those shares. Period.
I may as well just say it. Based on the present combination of extreme valuations, unfavorable and deteriorating market internals, and a rare preponderance of warning syndromes in weekly and now daily data, my impression is that the speculative market advance since 2009 ended last week.
With the market seeming to skate by the trap door of extreme valuations and unfavorable internals without consequence, the push to new highs in the past few weeks has created the impression of a runaway advance.
As of last week, the total return of the S&P 500 was even with 3-month Treasury bill returns since the valuation peak of January 2022, more than two years ago. In our view, investors continue to “grasp at the suds of yesterday’s bubble,” ignoring extreme valuations, lopsided bullish sentiment, emerging pressure on profit margins, economic conditions at the border of recession...
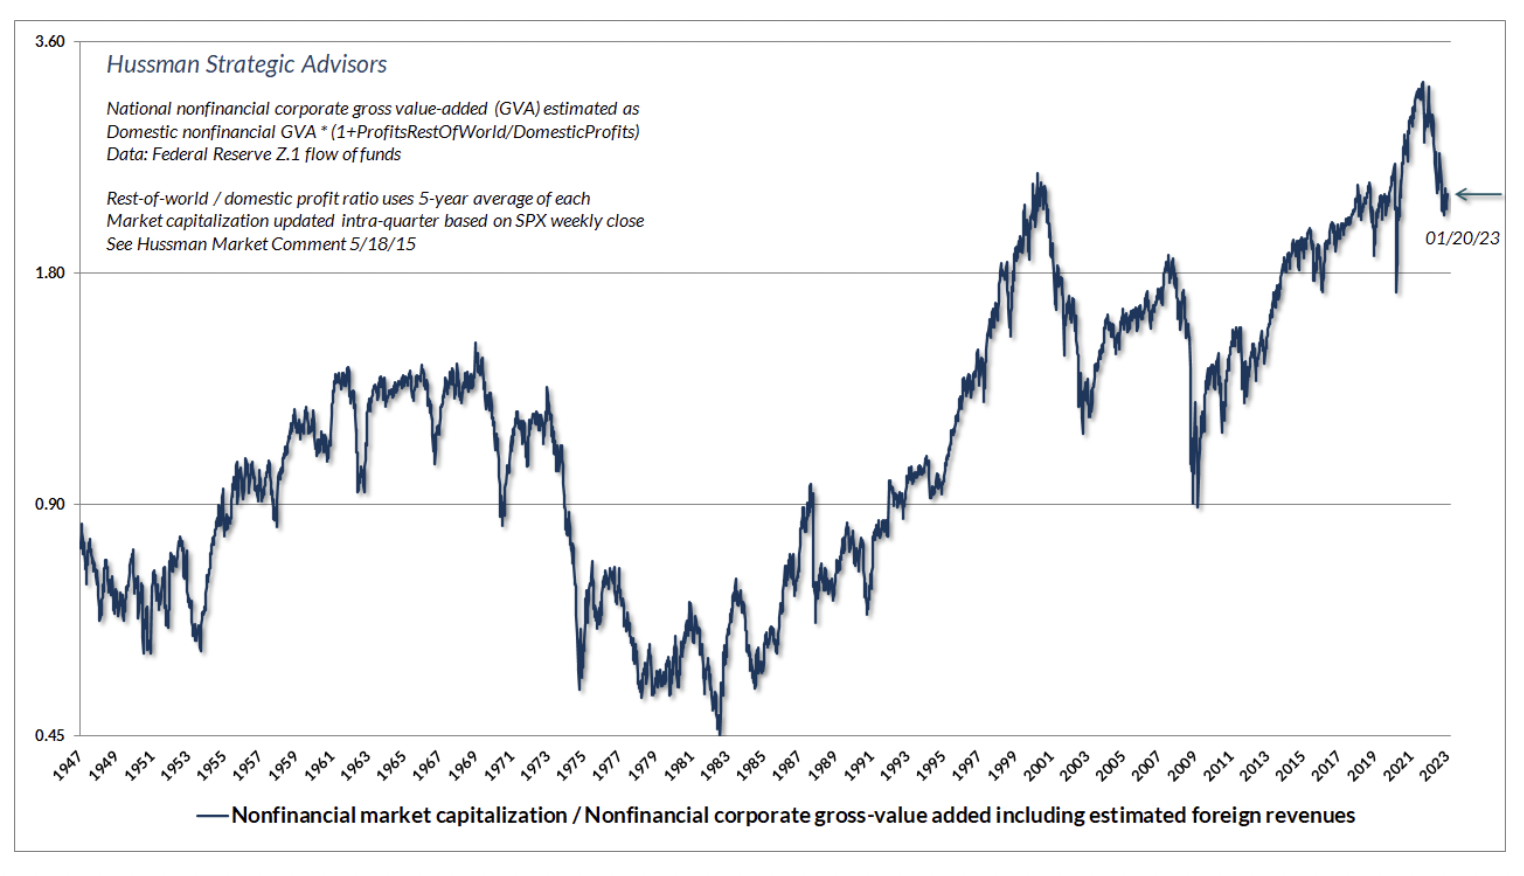
Based on the valuation measures we find best-correlated with actual subsequent S&P 500 total returns across a century of market cycles, the stock market presently stands at valuation extremes matched only twice in U.S. financial history.
If you’re losing your mind and plagued by fear of missing out, it might be that you’re best served with some passive investment exposure in your portfolio. Not because it will do well, at least not in our estimation, but so you don’t lose your mind.
As I observed last month, the strongest stock market returns in the coming decade, perhaps longer, are likely to emerge during advances in the S&P 500 that attempt to catch up with the cumulative return of risk-free Treasury bills.
The strongest stock market returns in the coming decade, perhaps longer, are likely to emerge during advances in the S&P 500 that attempt to catch up with the cumulative return of risk-free Treasury bills.
It’s worth noting that despite the recent market advance, our own investment discipline, and even Treasury bills, have outpaced the S&P 500 and Nasdaq 100 during this period, with less volatility.
For the better part of two years, investors have been primed with hope of a “Fed pivot” that will presumably restore easy monetary policy and supportive conditions for the financial markets.
A recent survey asking economists about the probability of recession next quarter shows a retreat in expectations from a high of 47 percent at the end of 2022 to just 34 percent, according to the Philadelphia Federal Reserve.
Value-conscious, historically-informed, full-cycle investors place a great deal of emphasis on the relationship between the price an investor pays today and the cash flows they can expect to receive in the future. The reason is simple.
On the interest rate front, the Federal funds rate is now close to systematic benchmarks that have historically been consistent with prevailing core inflation, nominal GDP growth, and unemployment.
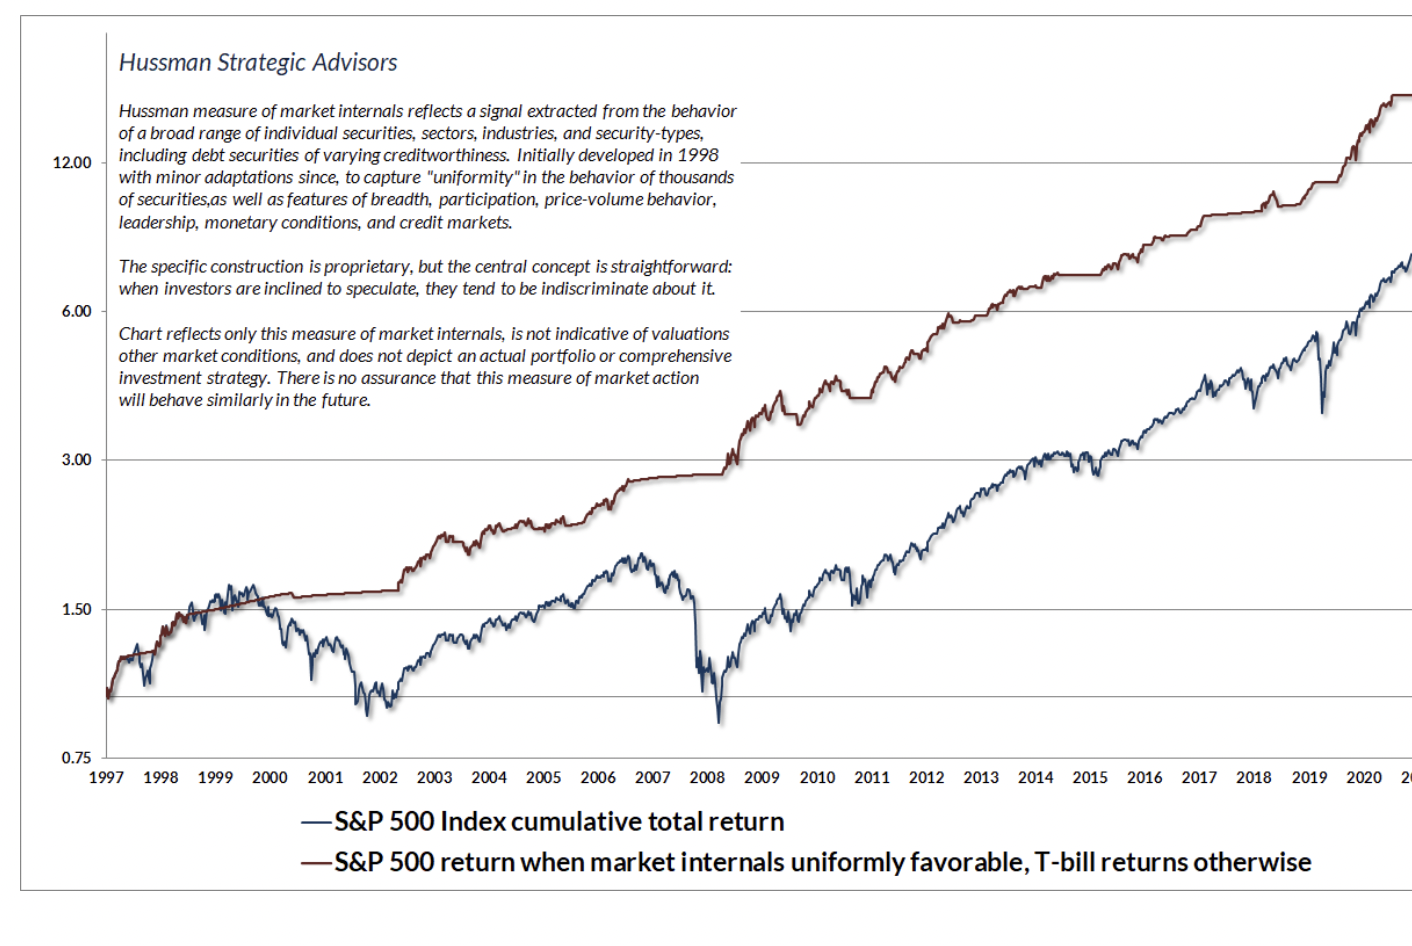
There is a particular “setup” that we’ve historically found to be associated with abrupt “air pockets” and “free falls” in the S&P 500. It combines hostile conditions in all three features most central to our investment discipline: rich valuations, unfavorable market internals, and extreme overextension.
Bull markets and bear markets can’t be identified in real-time – only in hindsight. More importantly, the return/risk profile of a “bull market” or a “bear market” can change dramatically depending on whether valuations are consistent with the beginning of a market cycle or the end of one.
Most of us spent moments of our childhood, crayon in hand, connecting numbered dots that gradually revealed a picture that we couldn’t deduce simply by looking at the separate dots. With experience, we got better at looking at those isolated dots and mentally connecting them into a coherent “gestalt.”
Amid the overabundance of economic opinion, unexamined clichés, and unverified assertions, and nutrient-free word salad dispensed by talking heads on television, market observers, and even Federal Reserve officials, I often wonder how many of them have ever taken the time to carefully examine historical data.
The simplest thing that can be said about current financial market and banking conditions is this: the unwinding of this Fed-induced, yield-seeking speculative bubble is proceeding as one would expect, and it’s not over by a longshot.
The extreme “tail” risk ahead may be disorienting.
The problem with speculation is that there’s usually a gap between the underlying risk and the inevitable outcome.
As of Friday, December 16, the S&P 500 Index is down -19.7% from the most speculative level of valuations in U.S. history – exceeding even the 1929 and 2000 extremes, based on the valuation measures we find best-correlated with actual subsequent market returns in cycles across history.
We continue to believe that a value-conscious, risk-managed, full-cycle discipline, focused on the combination of valuations and market internals, will be essential in navigating market volatility in the years ahead.