While US financial markets brace for what could be the three biggest initial public offerings ever, most entrepreneurship in the US is headed in the opposite direction: New businesses are shrinking.
If venture capital investment is a measure of the economic future, California would seem to have locked things up. In the first quarter of this year — by far the biggest quarter for US VC investment ever — an unheard-of 85% of the money went to California companies, according to the PitchBook-NVCA Venture Monitor. For all of 2025, California’s share was an also-unprecedented 60%.
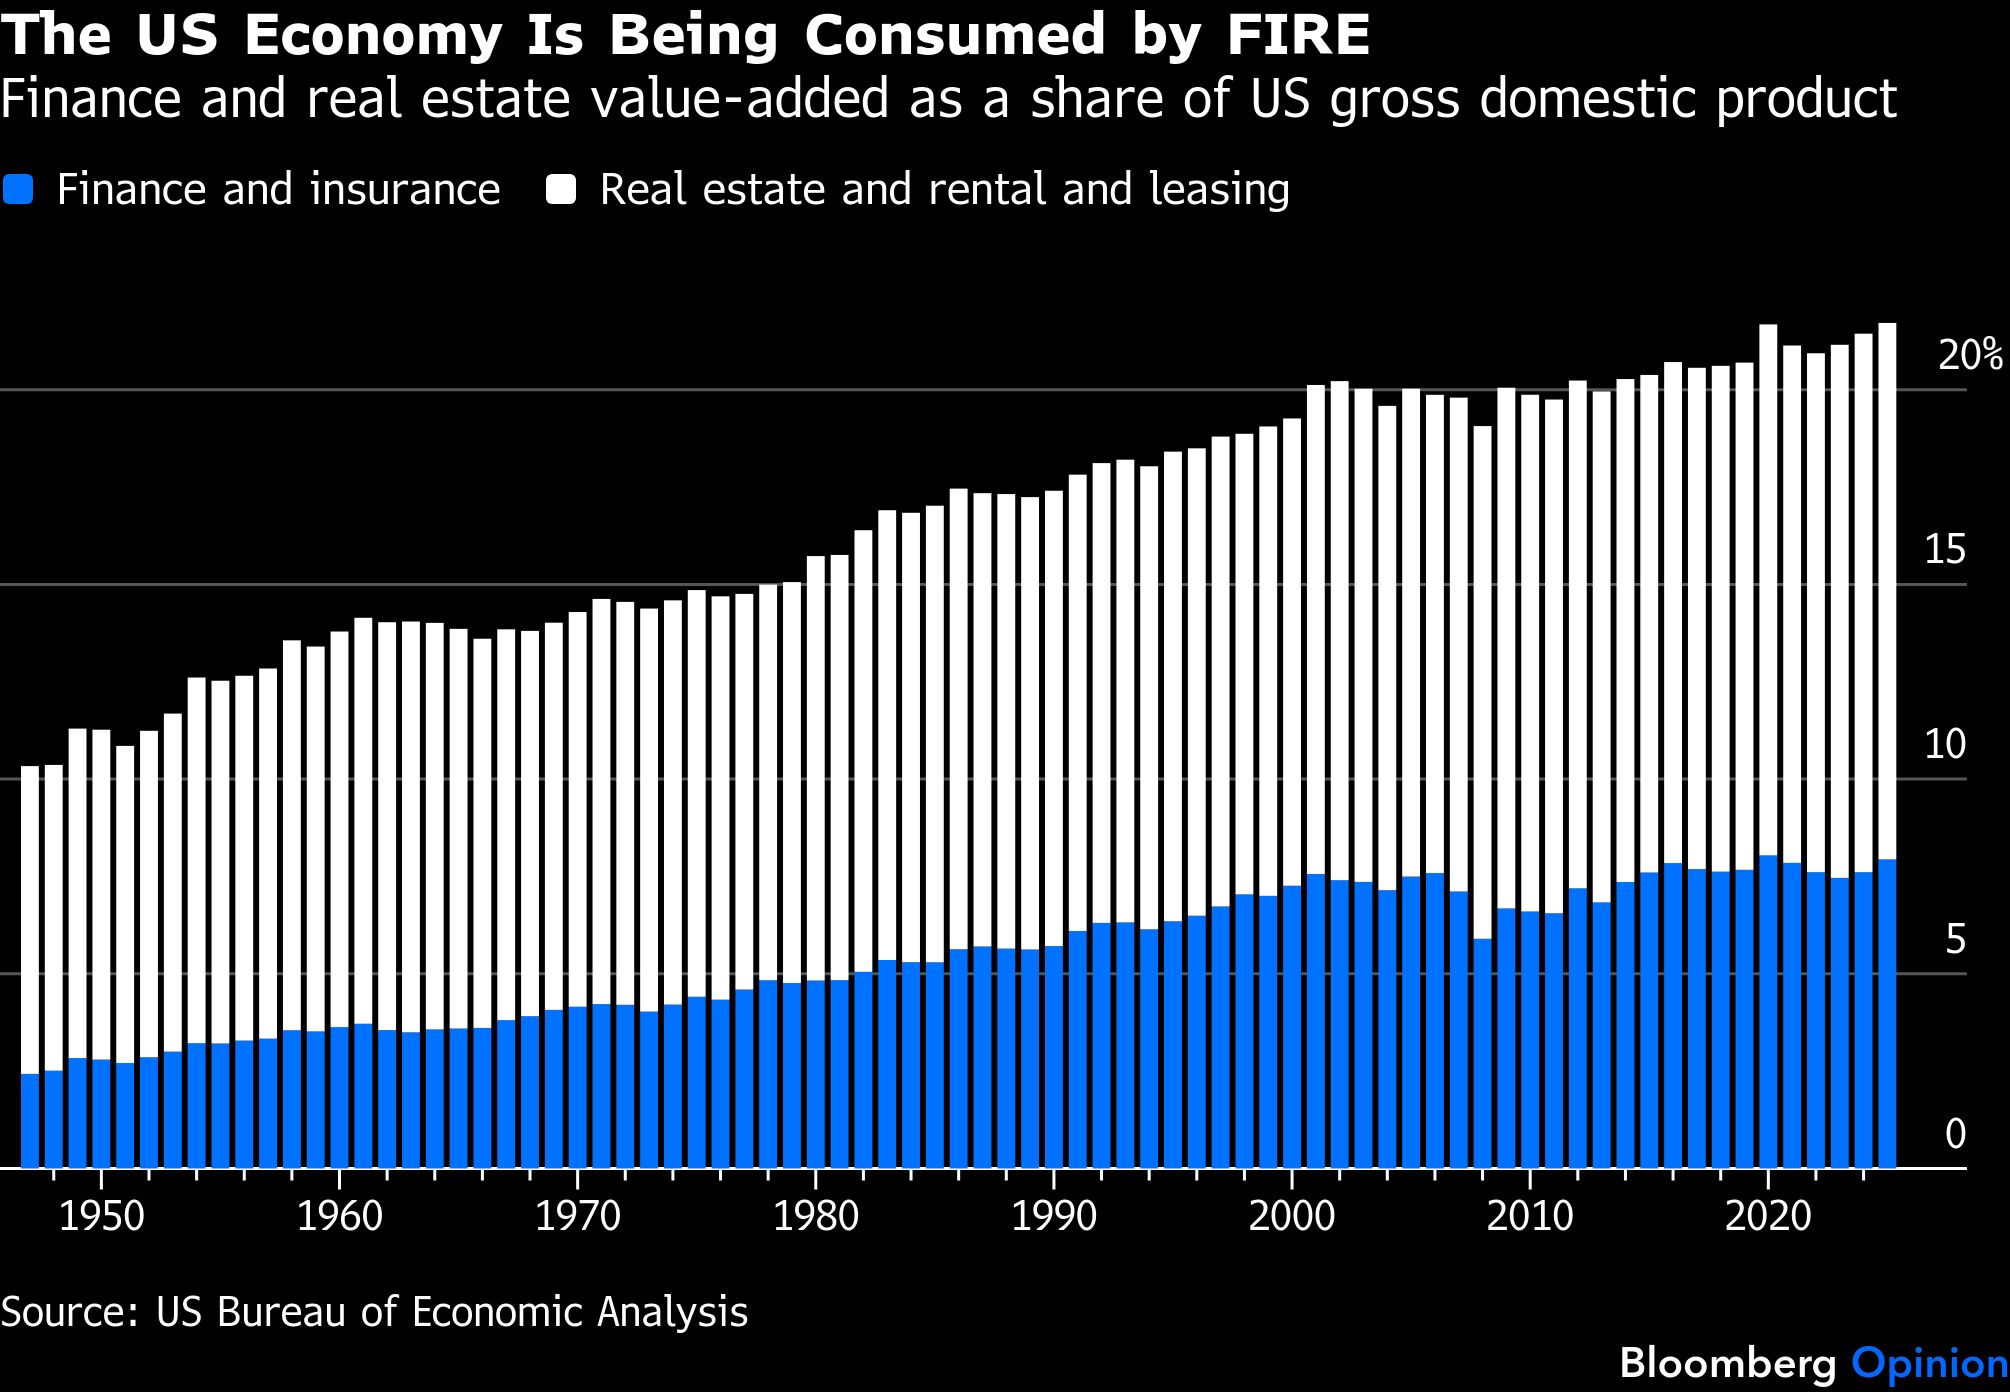
During and immediately after the financial crisis of 2008, there was much talk and academic research about the rapid growth of the US financial sector over the preceding decades and whether that was good or bad.
The defining statistic of the so-called K-shaped economy is a little hard to define.
Amid uncertain times in the job market one thing stands out — Americans in their 50s are working like never before.
Maybe we really are headed into a future in which technological change reduces the demand for skilled labor rather than increasing it. But the job market hasn’t been turned upside down just yet.
According to just about every significant economic indicator, including the December jobs numbers released Friday, the US economy is doing fine. Not great, mind you: Job growth stalled in 2025. But unemployment is low, gross domestic product growth is solid, and inflation is seemingly trending downward.
Getting rid of property taxes is a terrible idea. They are among the most economically efficient of taxes, meaning they don’t weigh on economic growth in the way that other taxes can.
In the years after the internet stock boom-and-bust of the late 1990s and early 2000s, financial economists searched for more satisfying explanations of what had happened than “investors went crazy.”
The boom in capital expenditures related to generative artificial intelligence is generating lots of questions about whether it is sustainable.
In a May report on alternative scenarios for the long-term US budget outlook, the Congressional Budget Office estimated the impact of productivity growth that was faster or slower than the 1% annual average in its baseline forecast. It made a big difference.
The US apartment-building boom that began about a decade ago appears to have ended last year, but it did so with a bang. It was the biggest year for apartment completions since 1986 and the biggest year ever for apartments in large buildings — that is, those with 30 to 49 and 50 or more units.
Given that the bill’s failure to reduce the deficit is due in part to its extension and expansion of the special tax treatment for non-corporate businesses that Johnson insisted on in 2017, which will cost an estimated $820 billion over the next decade, the senator does not make for the most credible of deficit hawks.
Iron and steel mills employ about 85,700 people in the US. That’s less than half as many as in 1990 but slightly more than in 2016 and 2017.
The Covid-19 pandemic brought some big shifts in the US labor market. The biggest was the departure of millions of older workers, ending a decades-long rise in employment and labor-force participation rates for those 65 and older.
Last week’s employment report offered what may be the last clear picture of the US job market before President Donald Trump’s tariff shock. Overall, it looked pretty healthy, with a 4.2% unemployment rate, 80.4% of the prime-age population employed and 1.9 million nonfarm payroll jobs added over the past 12 months.
There’s a lot of uncertainty over whether President Donald Trump will actually go through with all his planned tariffs, whether the economy will stall or go into reverse as a result, and whether Congress will eventually decide that it has had enough of ceding its tariff authority to the president.
The gap between US federal spending and tax revenue is currently bigger, as a share of gross domestic product, than it’s ever been outside of major war or other crisis.
The Tax Cuts and Jobs Act that President Donald Trump signed into law in December 2017 imposed a $10,000 limit on the amount of state and local taxes that can be deducted on a federal income tax return.
The $1.8 trillion federal budget deficit in the fiscal year that ended in September was the third biggest ever in dollar terms, trailing only the pandemic deficits of the 2020 and 2021 fiscal years. As a share of gross domestic product, a better gauge for historical comparisons, it was, at 6.4%, the biggest ever outside of a large war or global crisis.
Here’s something that would have seemed pretty much inconceivable two years ago: According to Zillow, home prices have now risen more in New York City and its environs since the beginning of 2020 than in metropolitan Austin, Texas.
Been with the same employer for 10 years or more? That doesn’t exactly make you a rarity in the US, where 30.2% of employed wage and salary workers were in that situation as of January 2024, according to data released last month by the Bureau of Labor Statistics. And while this percentage is down from a decade ago, it’s close to where things stood for the much of the 1980s, 1990s and 2000s.
As the monthly nonfarm payroll employment numbers repeatedly blew past economists’ forecasts over the past couple of years, one small sector in particular stood out.
After Covid-19 arrived in 2020, a lot of wealthy people fled locked-down California. Elon Musk, the world’s second-richest human, moved to Texas, griping that the Golden State had become “a little complacent, a little entitled.”
In the early months of the COVID-19 pandemic, many people with the means to do so left New York City and New York state. With state finances in particular highly dependent on high earners’ income taxes, this was a worrying development.
Three consecutive quarters of strong growth have put productivity either back on trend or well above it, depending on which recent trend line you’re following. Productivity’s sharp rise and fall from 2020 to 2022 was apparently just another one of those weird pandemic phenomena, now disappearing in the rearview mirror.
Last year was a record one for personal income taxes in the US and close to a record for taxes overall.
Market rents in the US are, depending on which measure you look at, either rising slowly or falling outright. Home purchase prices, after a slight dip last year, are climbing again.
Inflation is edging back toward pre-pandemic rates in the US, but rent inflation still has a long way to go. To put it into numbers, the all-items consumer price index was just 3.2% higher in October than a year earlier, but the rent of primary residence index was up 7.2%.
Since taking a big leap upward in the 1940s and 1950s, the homeownership rate in the US has been remarkably steady since the 1960s, with close to two-thirds of households owning their homes.
The Oakland Hills Public Use Microdata Area, or PUMA (a Census Bureau designation that I’ll explain in a moment), in Oakland, California, contains some of the most appealing urban neighborhoods in the US.
One of the scarier financial factoids making the rounds this year is that local and regional banks hold 70% of US commercial real estate debt.
In 1949, the list of the country’s most affluent metropolitan areas was dominated by Midwestern industrial cities.
Western countries have become increasingly wary of sharing technology with China, with the US and Netherlands recently imposing new restrictions on exports of semiconductors and the equipment used to make them.
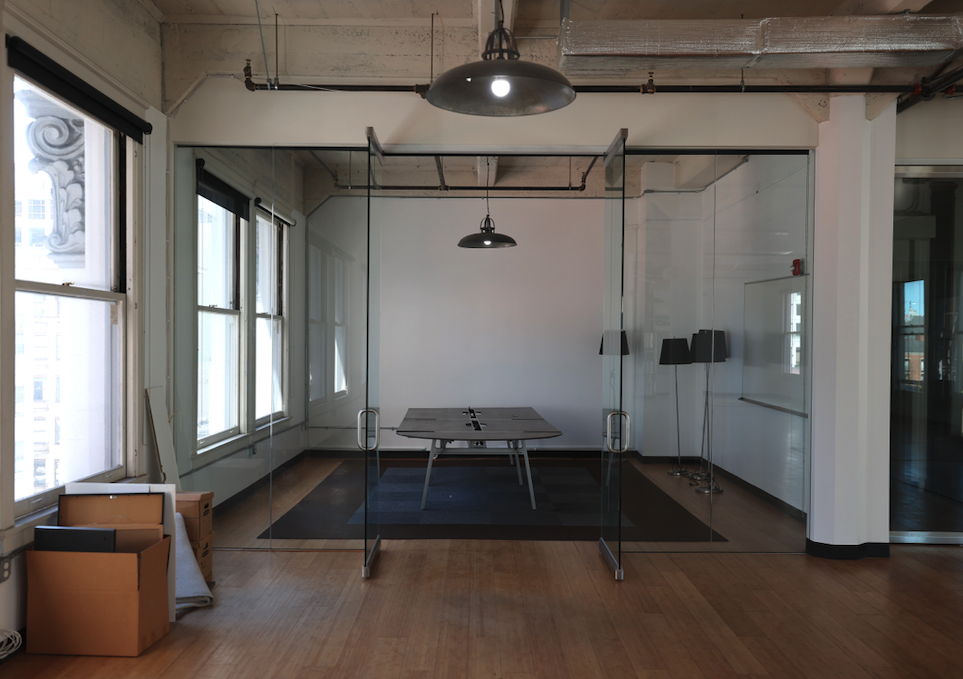
The rise of remote work during the pandemic has cut demand for office space and left some American downtowns feeling like ghost towns. As a result, there’s been much talk of converting downtown offices into apartments. This could not only bail out owners of suddenly less-valuable commercial real estate...
The layoff announcements coming lately from the chief executive officers of big technology companies all contain variations on the theme of “we hired too many people during the pandemic,” expressed with varying degrees of contrition.
After a respite in 2021 and 2022, US retailers appear headed for a flurry of bankruptcies, with Bed Bath & Beyond Inc. leading the way.
What is the cost, at this month’s market prices, of achieving the standard of living actually attained in the base period?
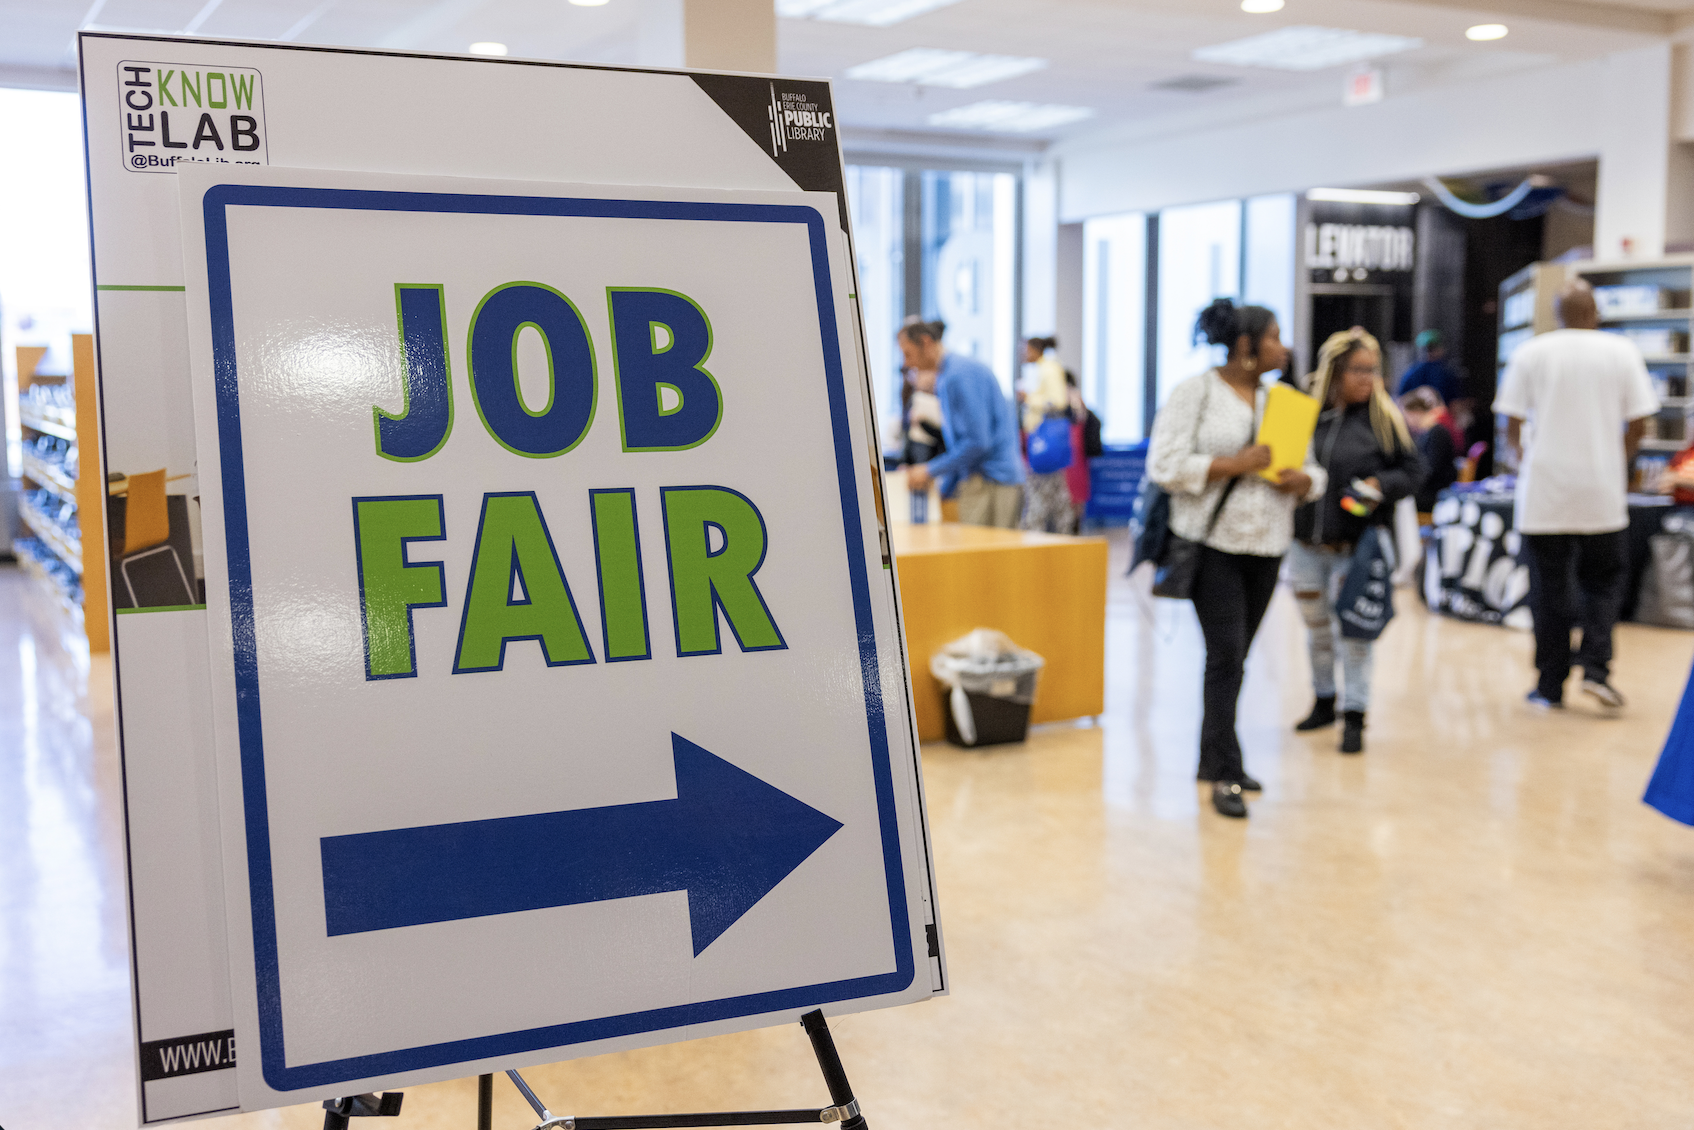
Businesspeople in the US have been complaining for more than a year about how hard it is to hire anybody.
Americans in their early 60s are pretty close to record labor-force participation, too. The big declines are all among those 65 and older.
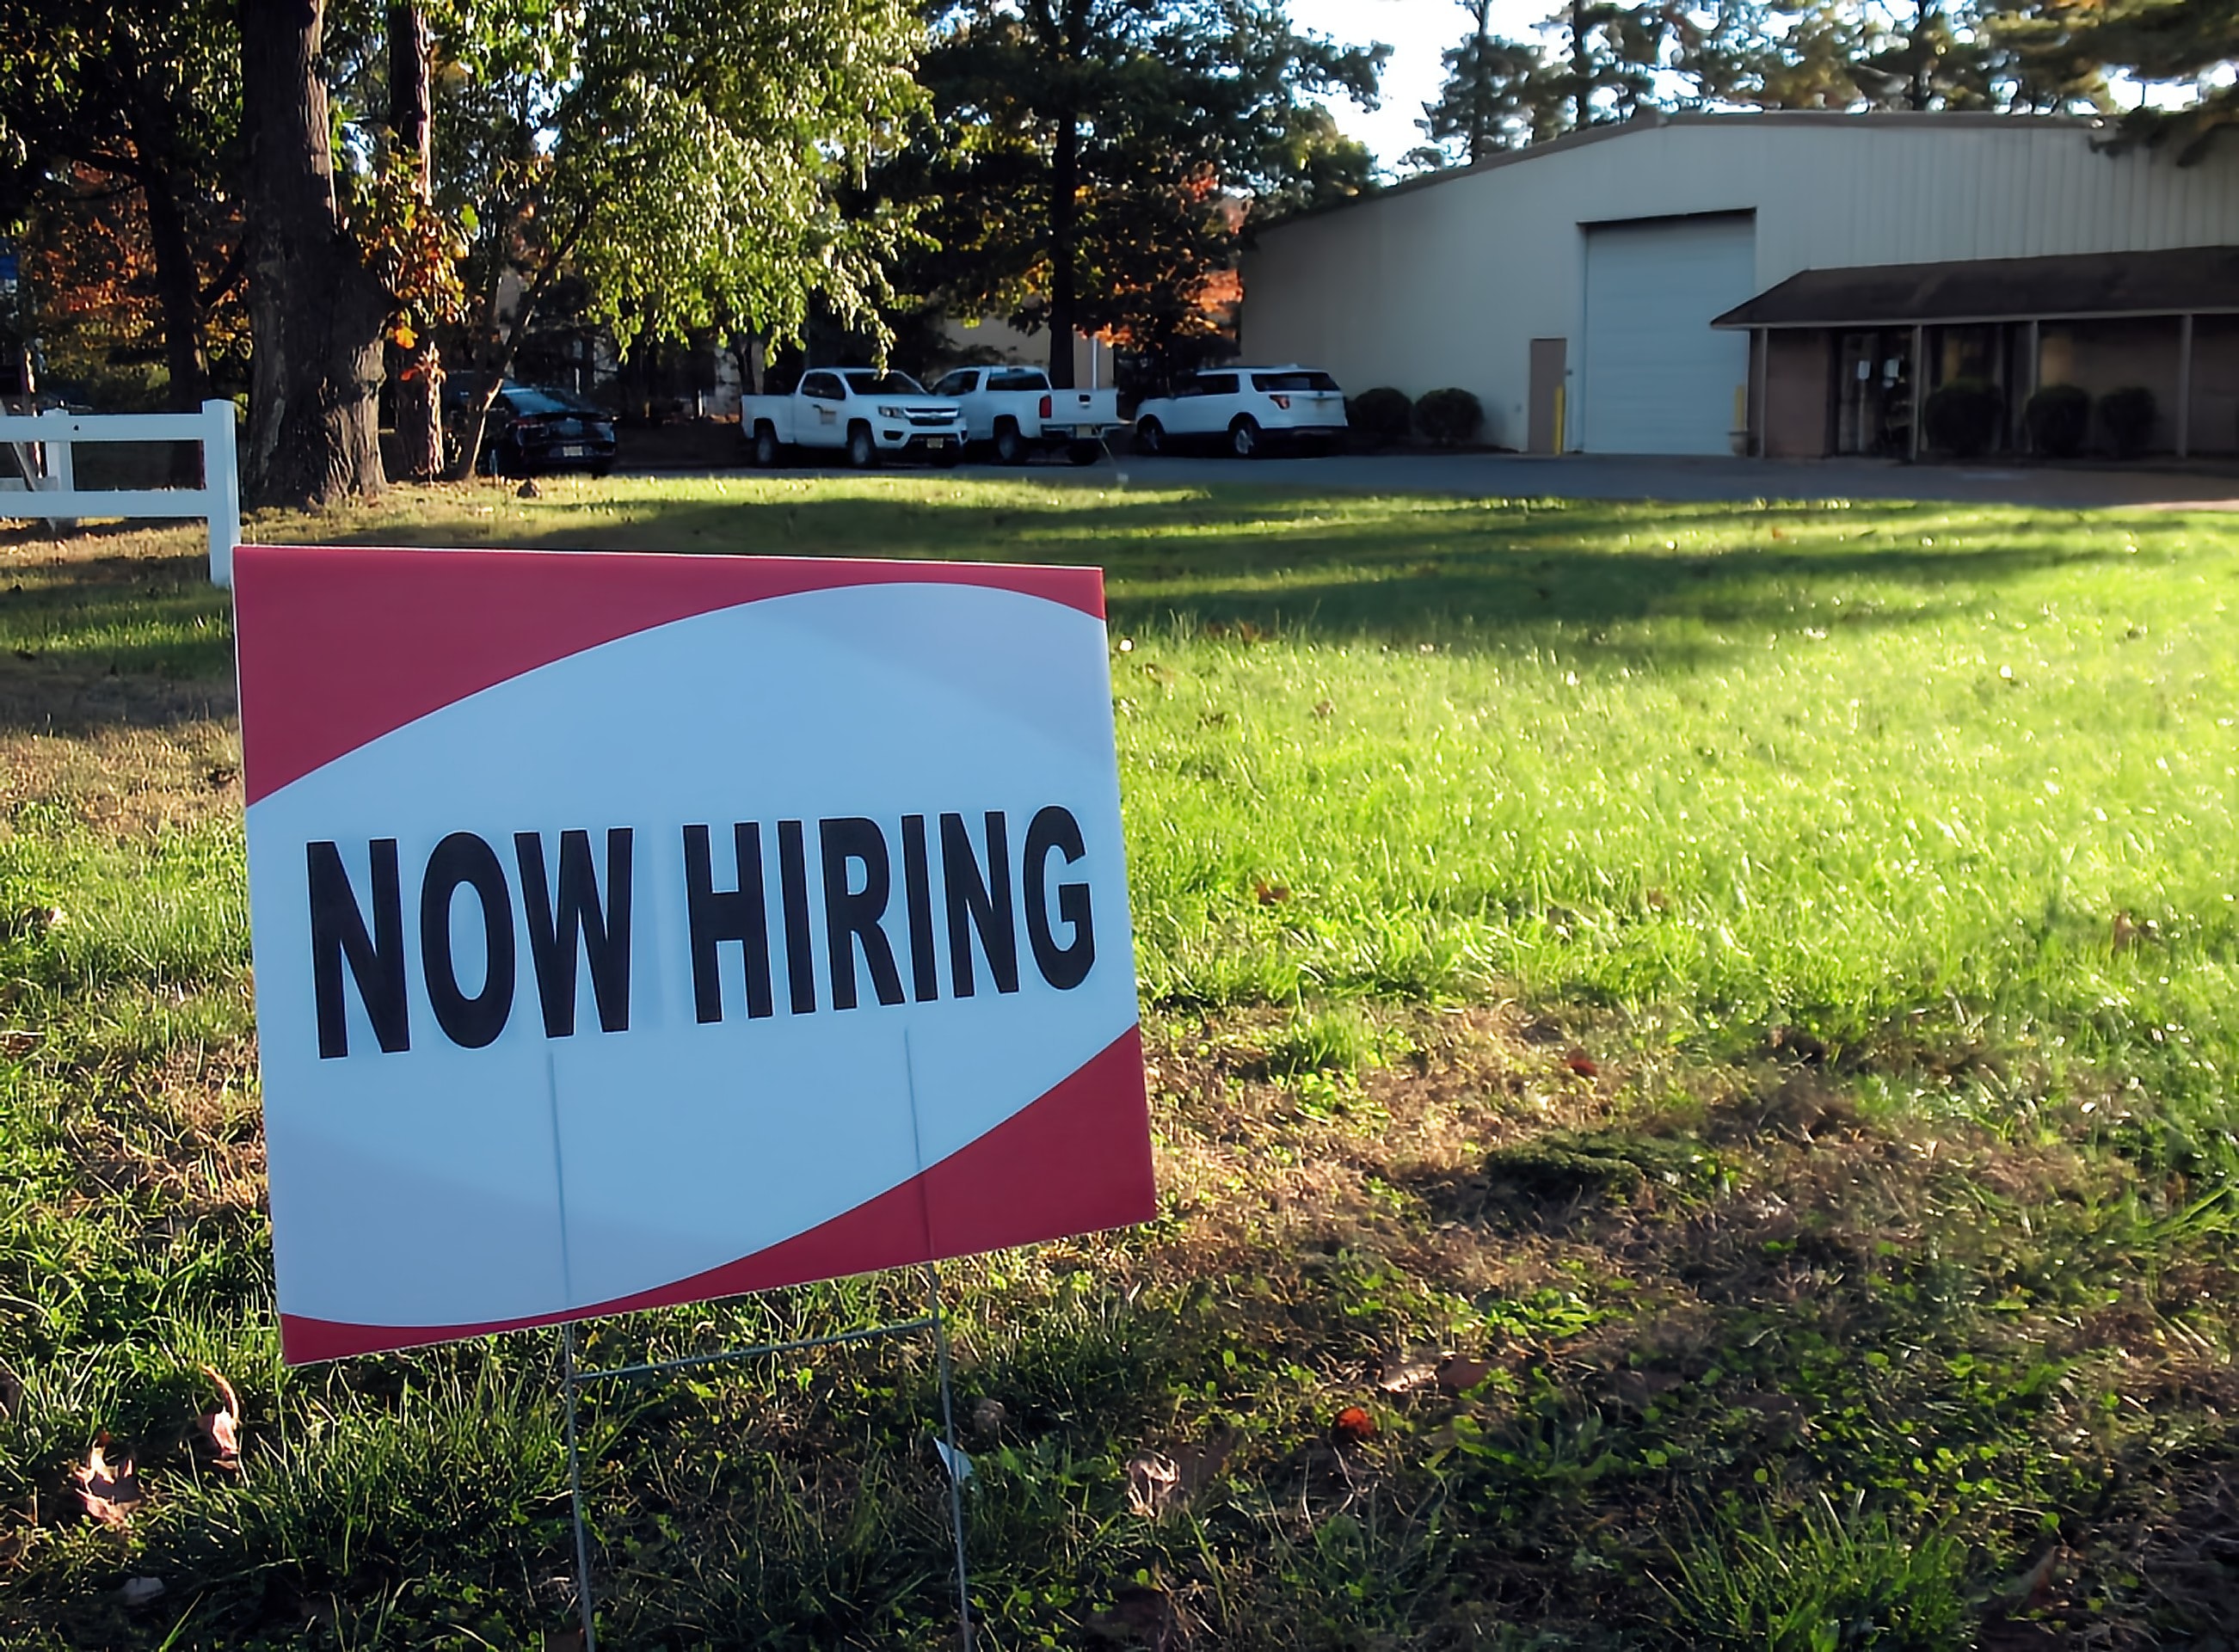
Today’s jobs report made clear that despite rising interest rates and incessant recession talk, American businesses are still hiring.
The Consumer Price Index for All Urban Consumers (CPI-U) was unchanged in July on a seasonally adjusted basis after rising 1.3 percent in June, the U.S. Bureau of Labor Statistics reported today. Over the last 12 months, the all items index increased 8.5 percent before seasonal adjustment.
As you may have heard, the US inflation rate is 9.1%. That is, the consumer price index for all items as estimated for June by the Bureau of Labor Statistics was 9.1% higher than it was a year earlier.
Gasoline consumption in the US probably peaked in the years before the pandemic.
US builders completed more apartments in large multi-unit buildings than ever before.
That the Covid-19 pandemic would bring a big decline in poverty in the U.S. is not something a lot of people were predicting back in March 2020.
When the pandemic hit last year, young adults moved back in with their parents in a big way. Now the share of 18-to-29-year-olds living with parents and grandparents is back about where it was before Covid-19 arrived.
The employment-to-population ratio of Americans ages 25 through 54, the most straightforward measure of the health of the job market, has now clawed back about 80% of its pandemic losses.
Consumer spending on durable goods fell for the sixth month in a row in September, according to inflation-adjusted data released last week.
The brief-but-sharp 2020 recession and its aftermath are already shaping up a lot differently for college enrollment. Census Bureau data released last week, included in the above chart, shows a modest 0.7-percentage-point overall enrollment decline from the previous year as of October 2020 — albeit with an interesting divergence between men (down 1.5 points) and women (down 0.2).