The U.S. economy sent conflicting signals last week as a sharp deceleration in growth collided with unexpectedly stubborn inflation.
Advisors can foster a stronger relationship with their clients through providing advice over charitable giving.
The U.S. economy began 2026 with a display of unexpected resilience in the labor market and cooling inflation.
SEC White Paper: Do fund mergers lower fees? Explore how economies of scale impact expense ratios and performance for ETFs and mutual funds.
The surge in active ETF launches aligns with broader market trends. For example, active ETF strategies accounted for roughly 60% of new ETF launches in the early months of 2025, underscoring the category’s growing momentum and advisor interest.
The U.S. labor market showed further signs of cooling last week as private sector hiring slowed and job openings reached their lowest levels in over five years.
Vanguard CIO Lauren Wilkinson shares a strategic roadmap for RIAs curious about AI integration for their practice.
ETF industry and State Street Investment Management leader Matt Bartolini joined VettaFi's Todd Rosenbluth to talk diversification.
Throughout most of 2025, silver has recently outperformed gold, proving (ironically) that it is not always second place. Strength in silver built gradually through last year, but the latest pullbacks are a reminder that near-term market reactions can outweigh fundamentals and long-term investor sentiment.
Active fixed income ETFs stand out amid the broader transition from mutual funds to ETFs, with DSCO a recent switch.
The ETF industry has carried its record-breaking momentum from 2025, surpassing $100 billion in flows before the end of January.
In a move that underscores the relentless downward pressure on investment costs, Vanguard announced that it has slashed fees for 84 mutual fund and exchange-traded share classes. These reductions, spanning 53 different funds, represent nearly $250 million in estimated savings for investors in 2026 alone.
The final week of January saw a stark divergence between official policy and the American consumer's outlook. While the Federal Reserve maintained a "solid" view of economic growth, the public’s mood plummeted to a decade-low as sticky amid sticky wholesale inflation.
The U.S. economy continues to display a complex mix of resilience and persistence. As markets brace for next week’s FOMC meeting, this snapshot breaks down the latest shifts in GDP, inflation, and consumer behavior.
Recent acquisition deals highlight asset managers’ race to capture the booming demand for model portfolios and outsourced investment solutions.
The champagne has gone flat. After months of planning the great breakaway, signing independence paperwork, and celebrating freedom from wirehouse constraints, newly minted registered investment advisors (RIA) owners face a sobering reality. They've traded a boss for a back-office burden that's quietly strangling their growth.
As the second half of January begins, the U.S. economy presents a picture of cooling inflation and resilient consumer activity.
Market experts from the WisdomTree recently discussed how the market is responding to the latest headlines, and where opportunities lie.
DoubleLine CEO/CIO Jeffrey Gundlach looked back at 2025 and ahead in 2026 for opportunities, with charts to support his assertions.
JPMorgan Chase and Delta Air Lines have both posted fascinating Q4 earnings, creating compelling opportunities for crafty advisors.
As the S&P 500 continues its record-breaking ascent into early 2026, financial advisors are prioritizing diversification.
Rising operational costs & complex market conditions are forcing some advisors to reconsider how they deliver investment insights to clients.
The ETF ecosystem grew once more in December with more than 100 new launches joining the fray. Three funds invite a closer look.
JPAPM forecasts the global fixed income ETF market to grow to $6 trillion by 2030, up from approximately $3.2 trillion today.
Now that 2025 has come to an end, let’s take a look at the top 10 most-read charts of the year.
Three ways financial advisors can be more productive in the new year after starting their own independent practice.
Income ETFs can help retirees and their advisors navigate complicated economic times as they strive to meet their goals.
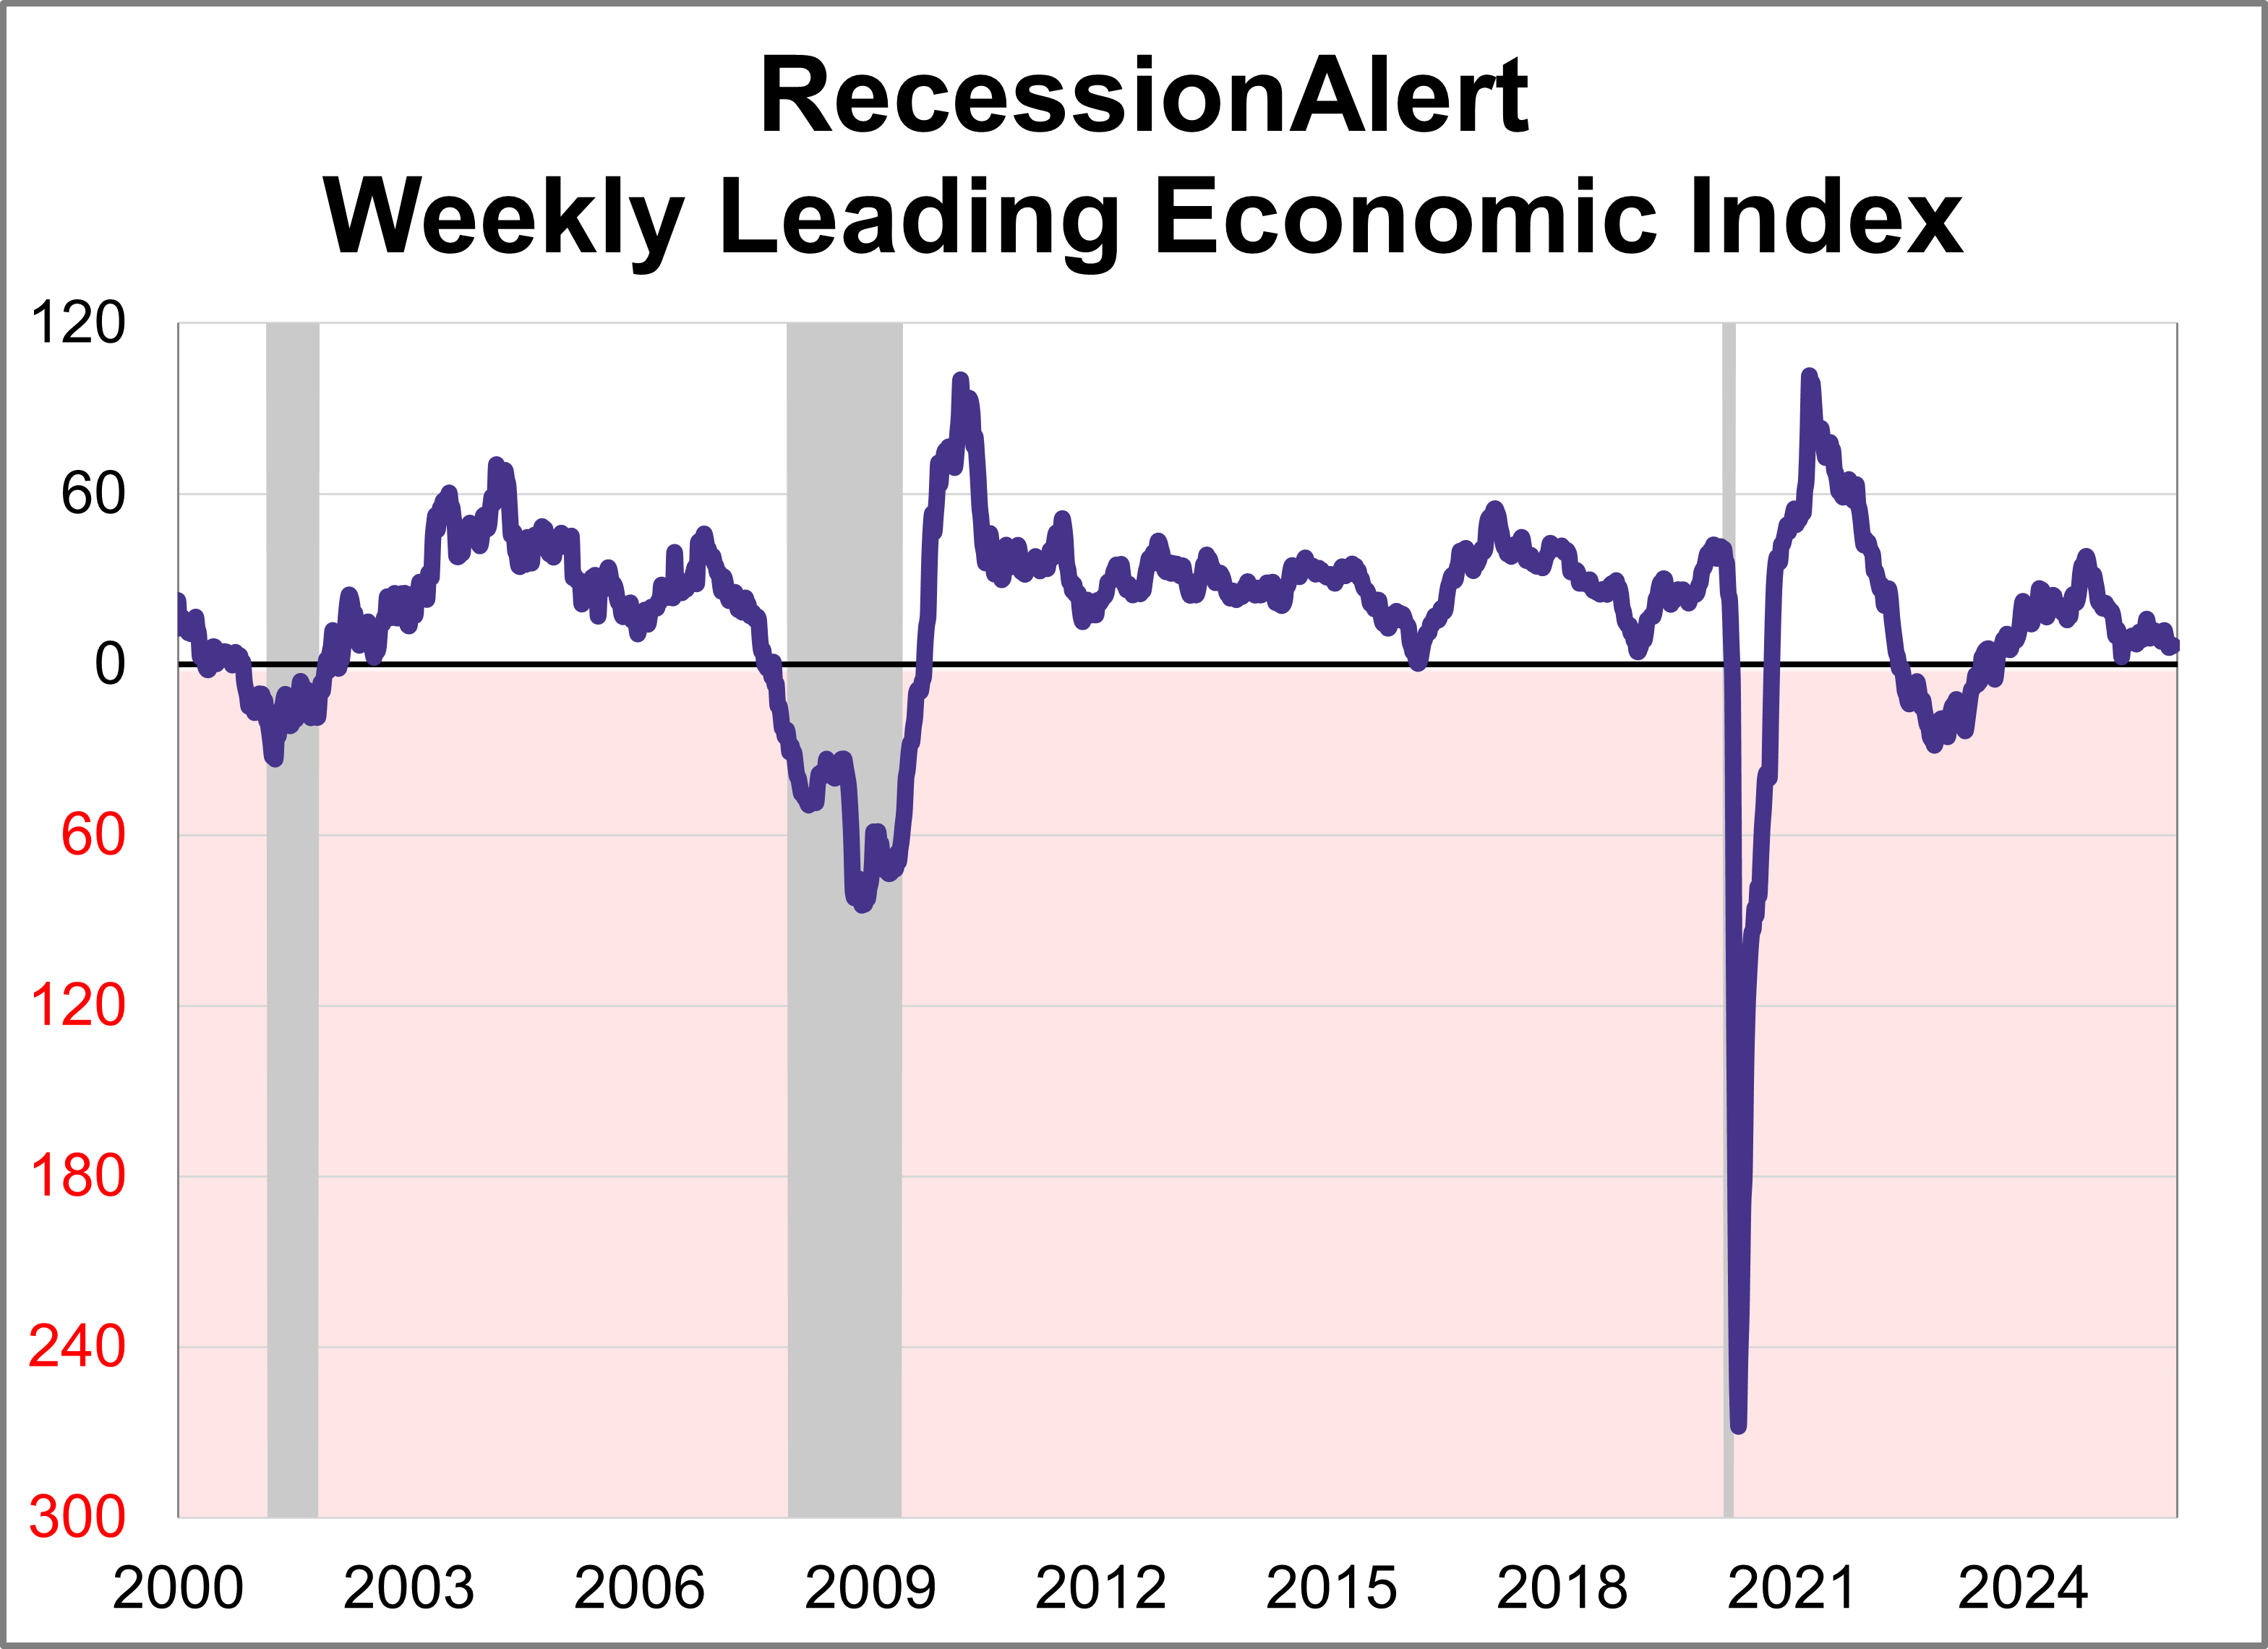
The weekly leading economic index (WLEI) is a composite for the U.S economy that draws from over 20 time-series and groups them into the following six broad categories which are then used to construct an equally weighted average. As of December 12th, the index was at 6.71 with 3 of the 6 components in expansion territory.
Our monthly workforce recovery analysis has been updated to include the latest employment report for November. The unemployment rate inched up to 4.6%, its highest level since 2021. Additionally, the number of new non-farm jobs (a relatively volatile number subject to extensive revisions) came in at 64,000.
The economic narrative last week was shaped by a highly anticipated Federal Reserve rate cut, which came against a backdrop of conflicting signals in the labor market.
The economic narrative last week was dominated by a mix of cooling inflation and a softening labor market.
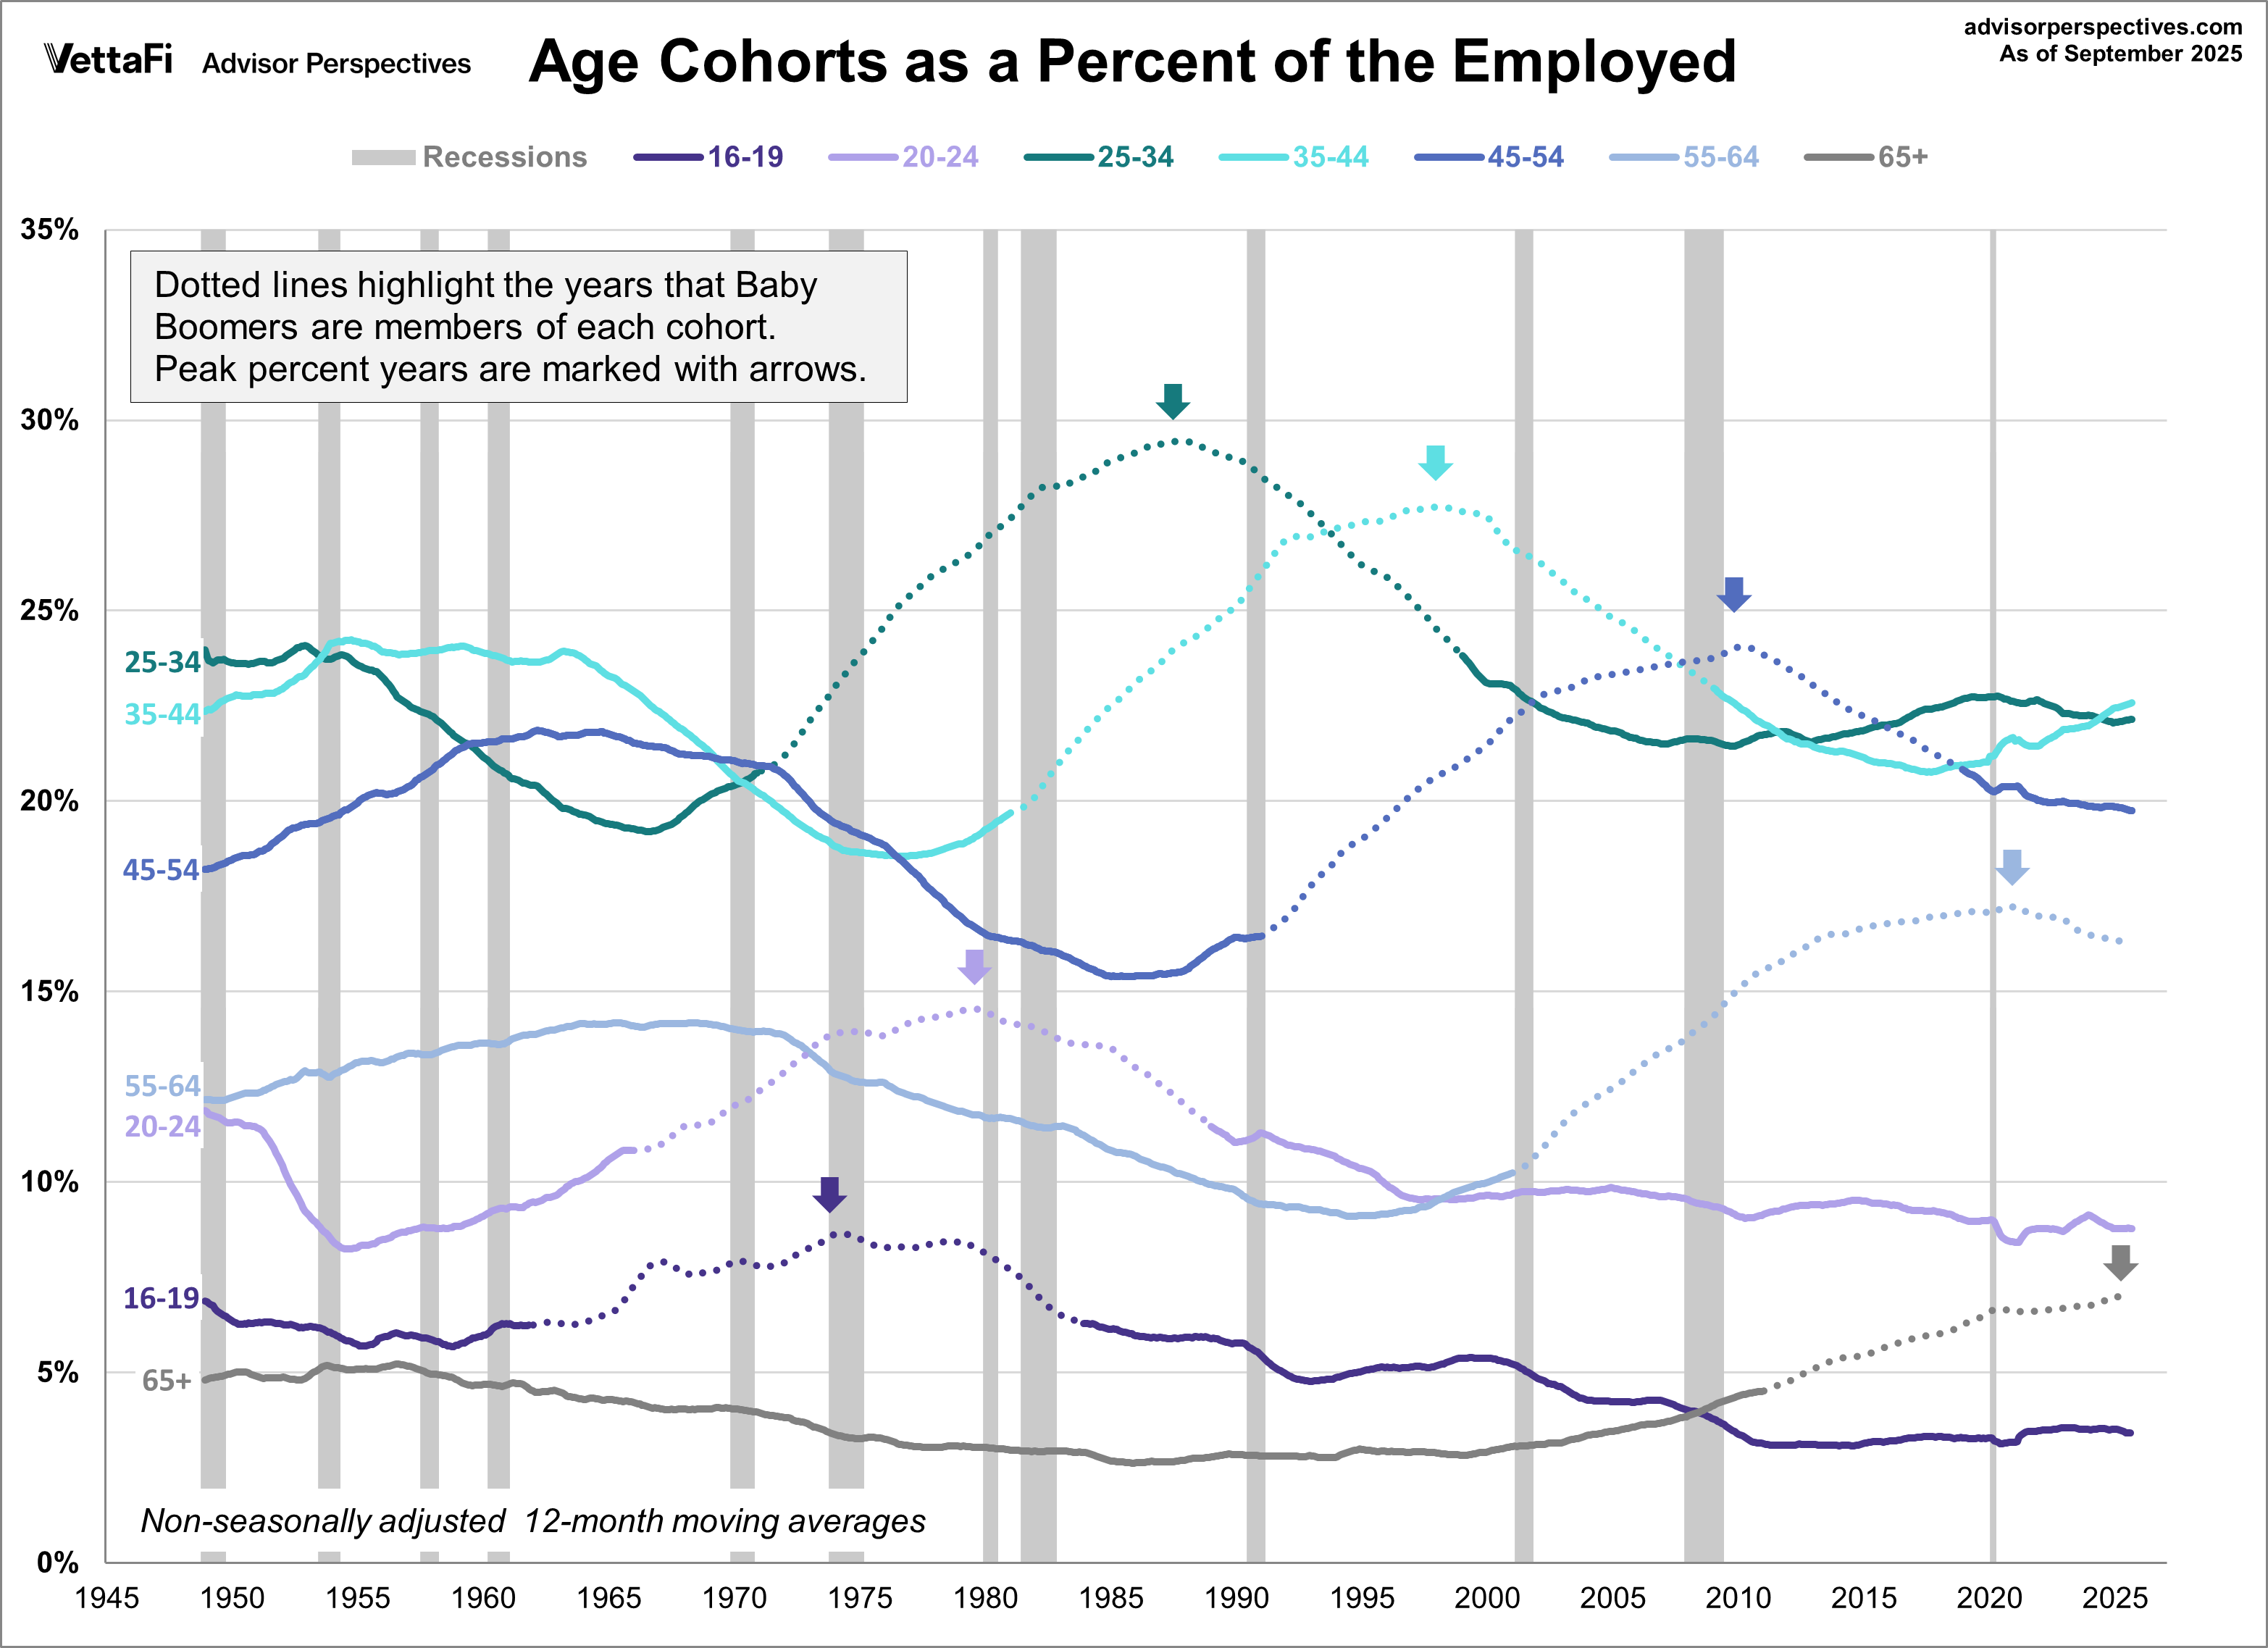
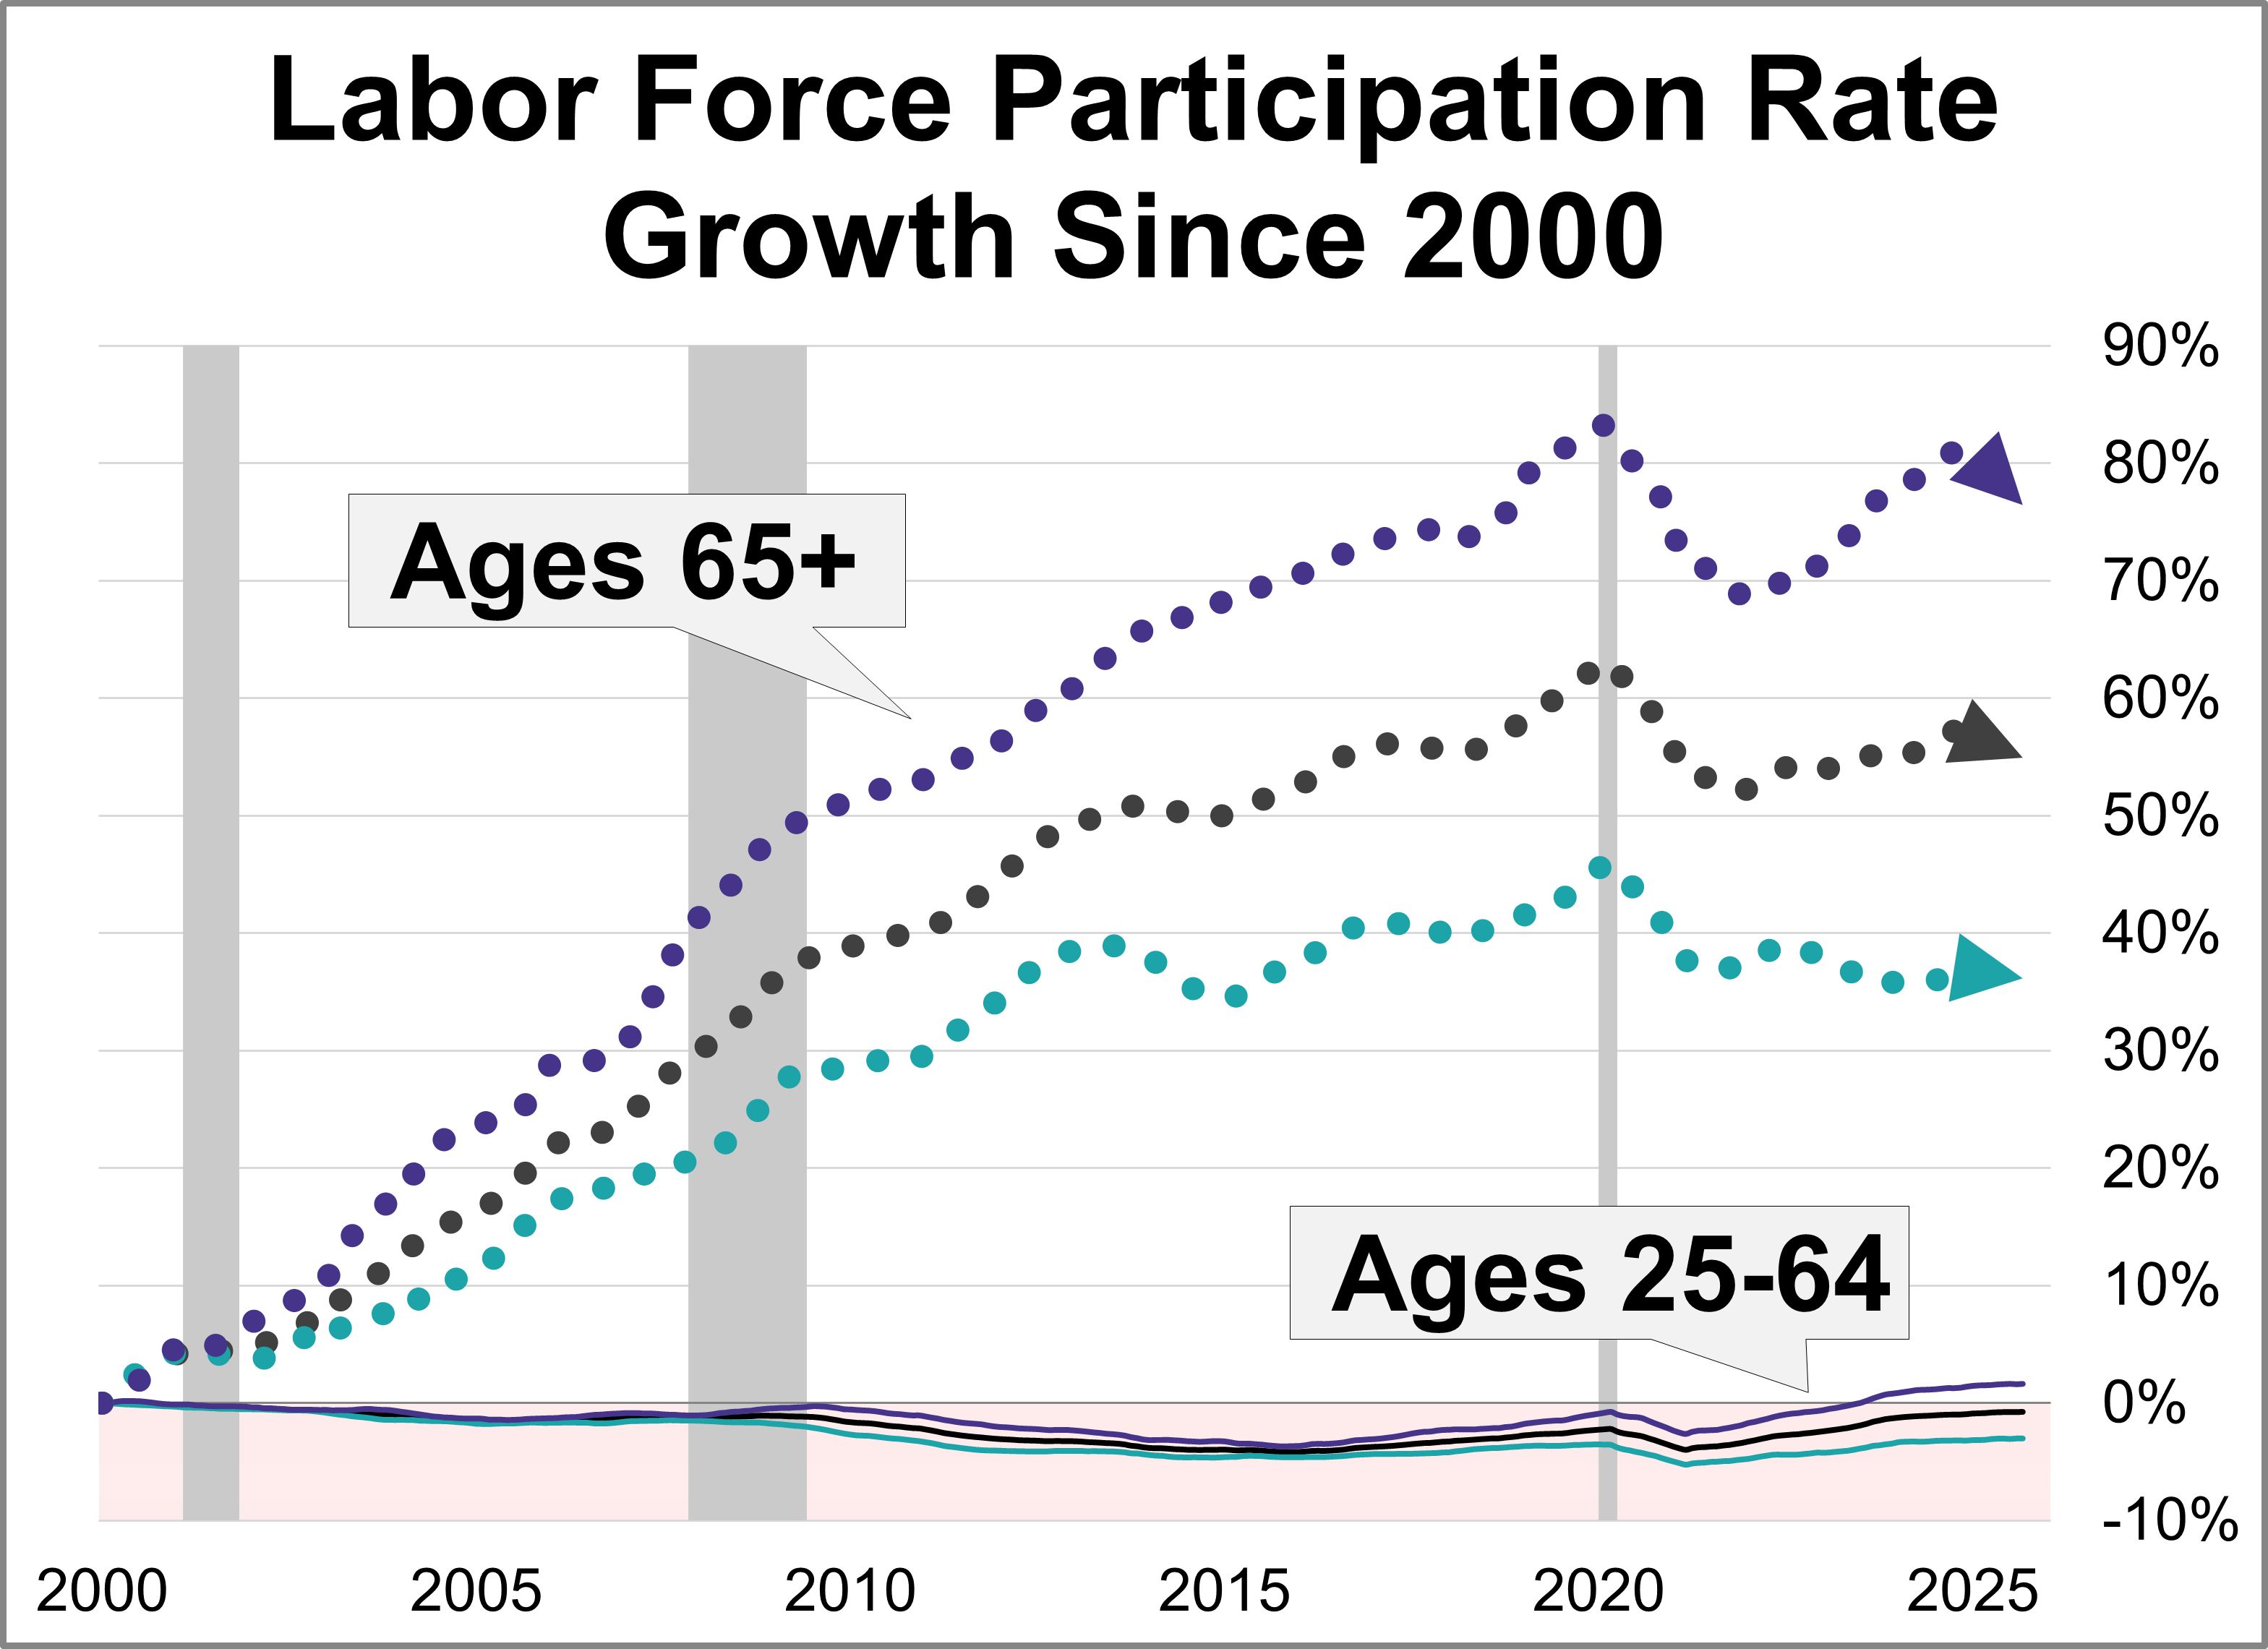
The 20th century Baby Boom was one of the most powerful demographic events in the history of the United States. We've created a series of charts to show seven age cohorts of the employed population from 1948 to the present.
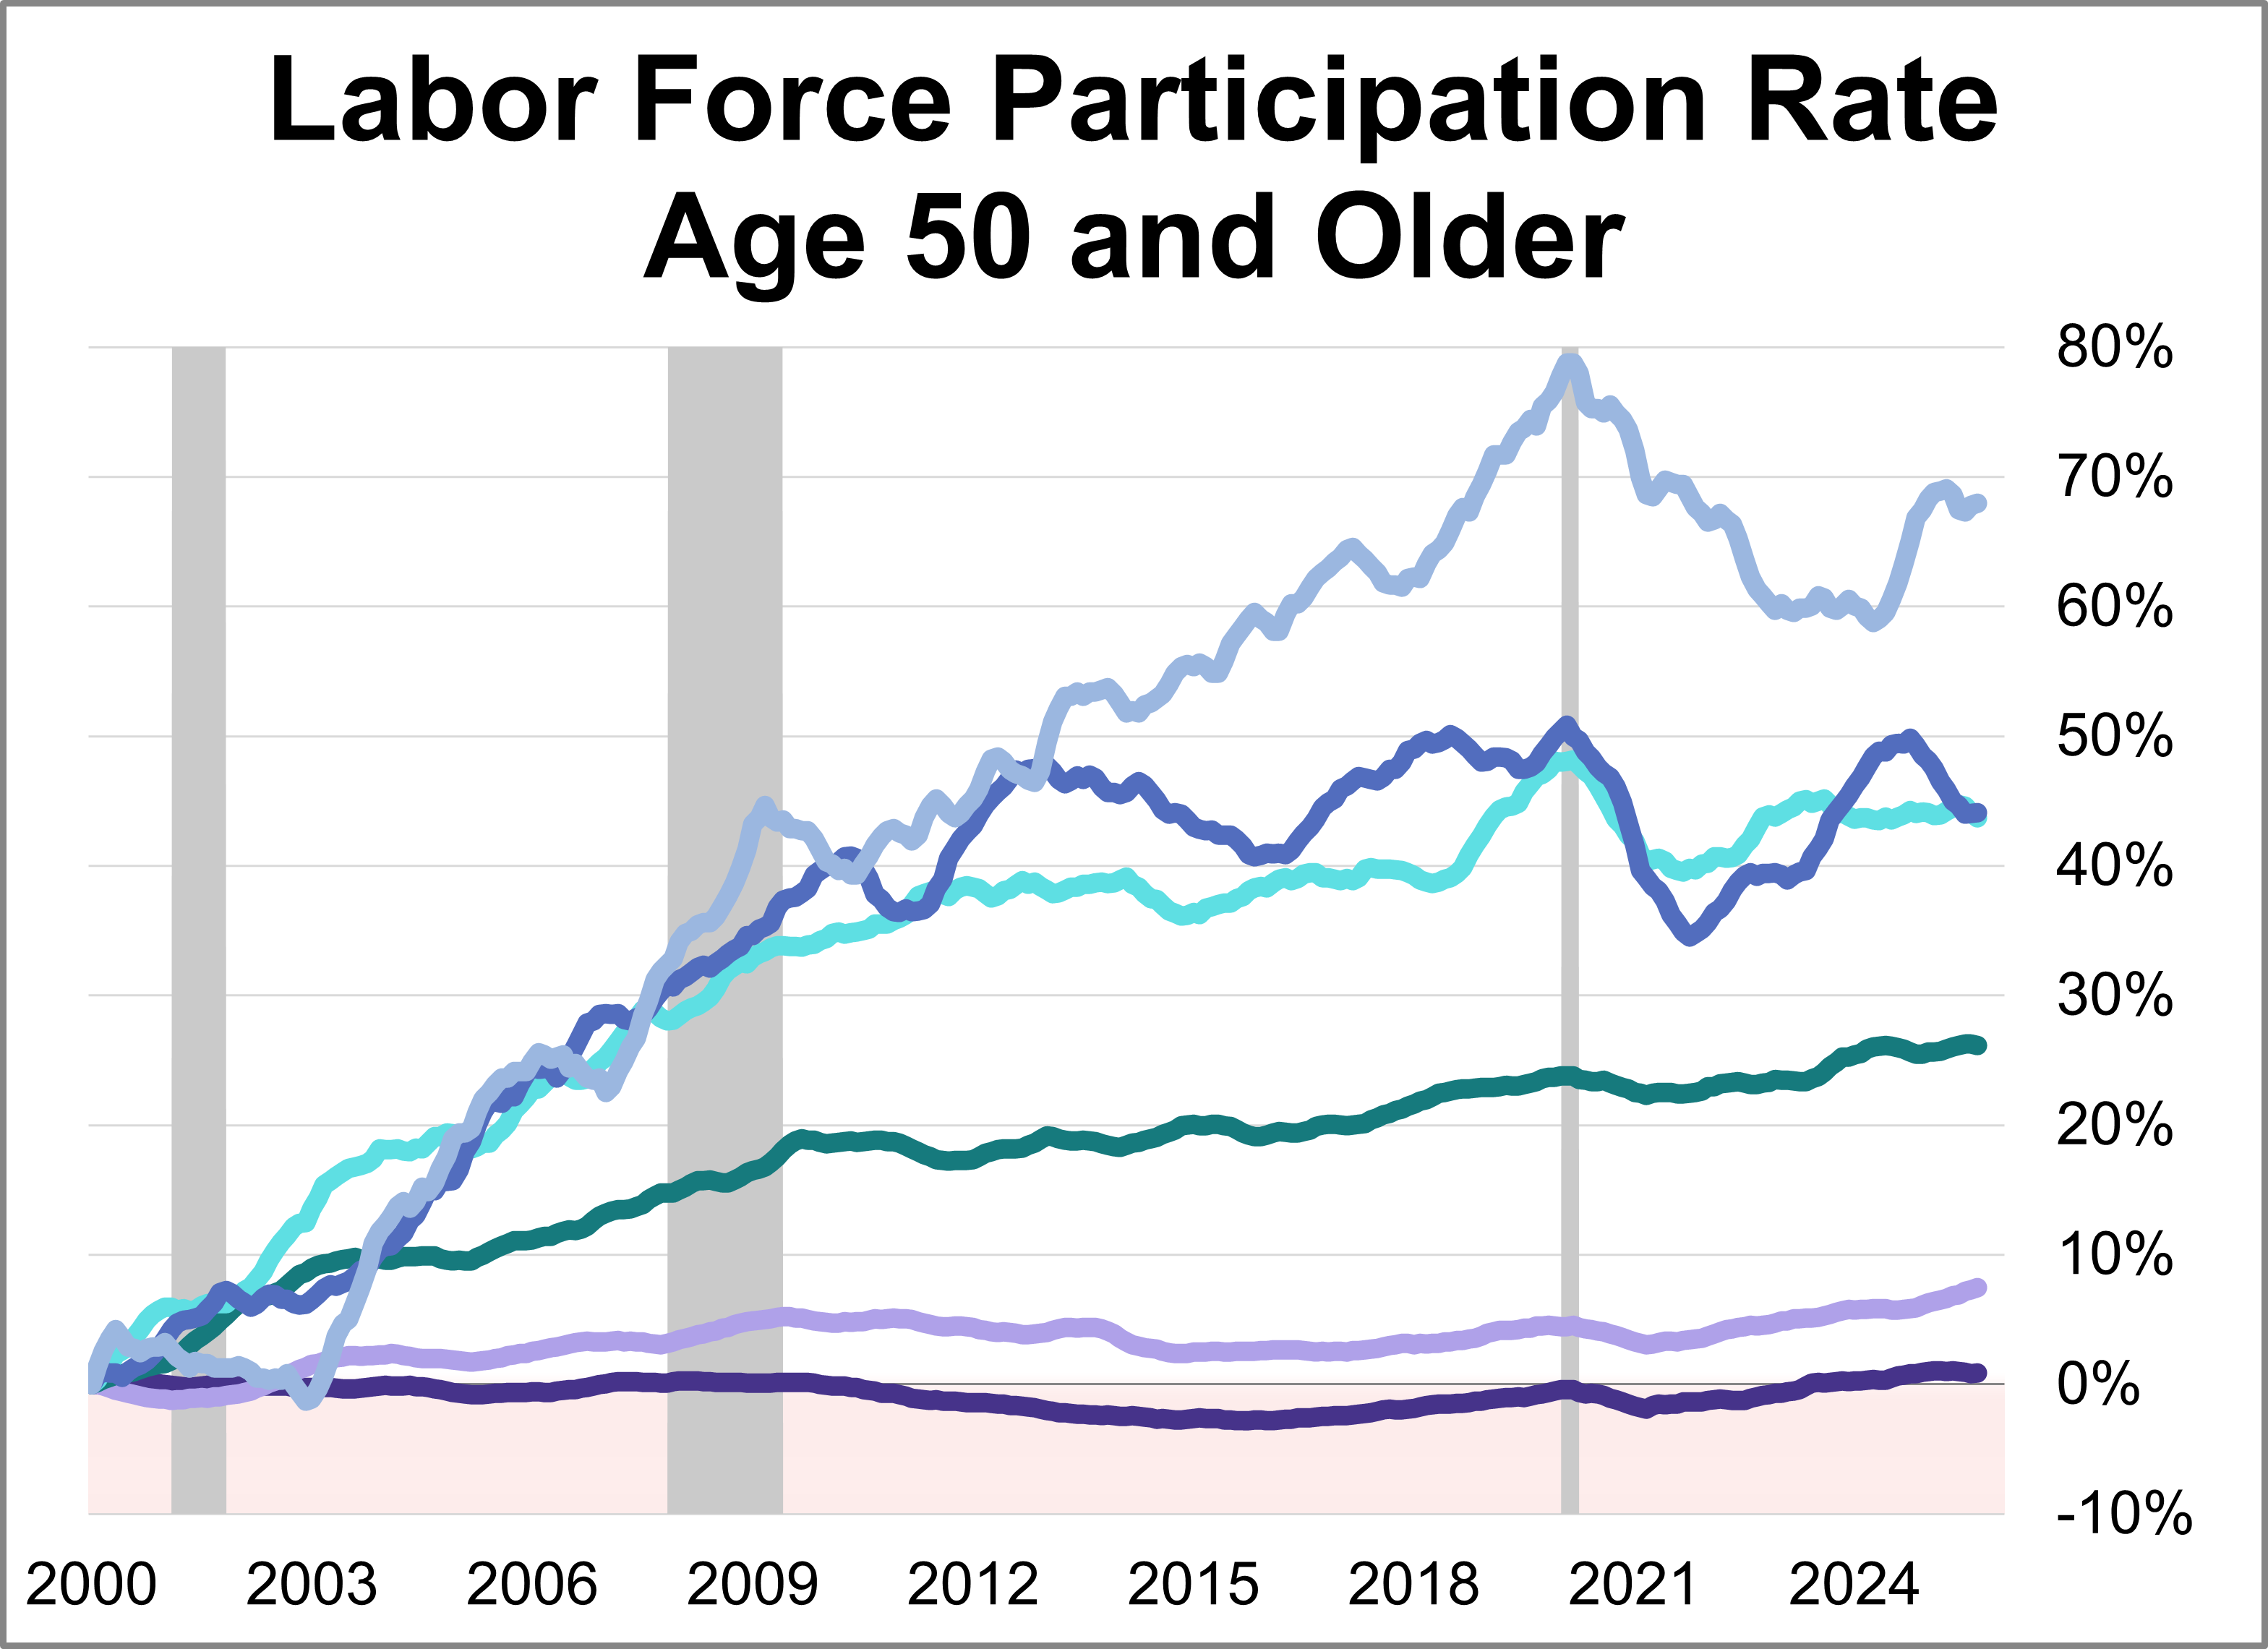
Today, one in three of the 65-69 cohort, one in five of the 70-74 cohort, and one in ten of the 75+ cohort are in the labor force.
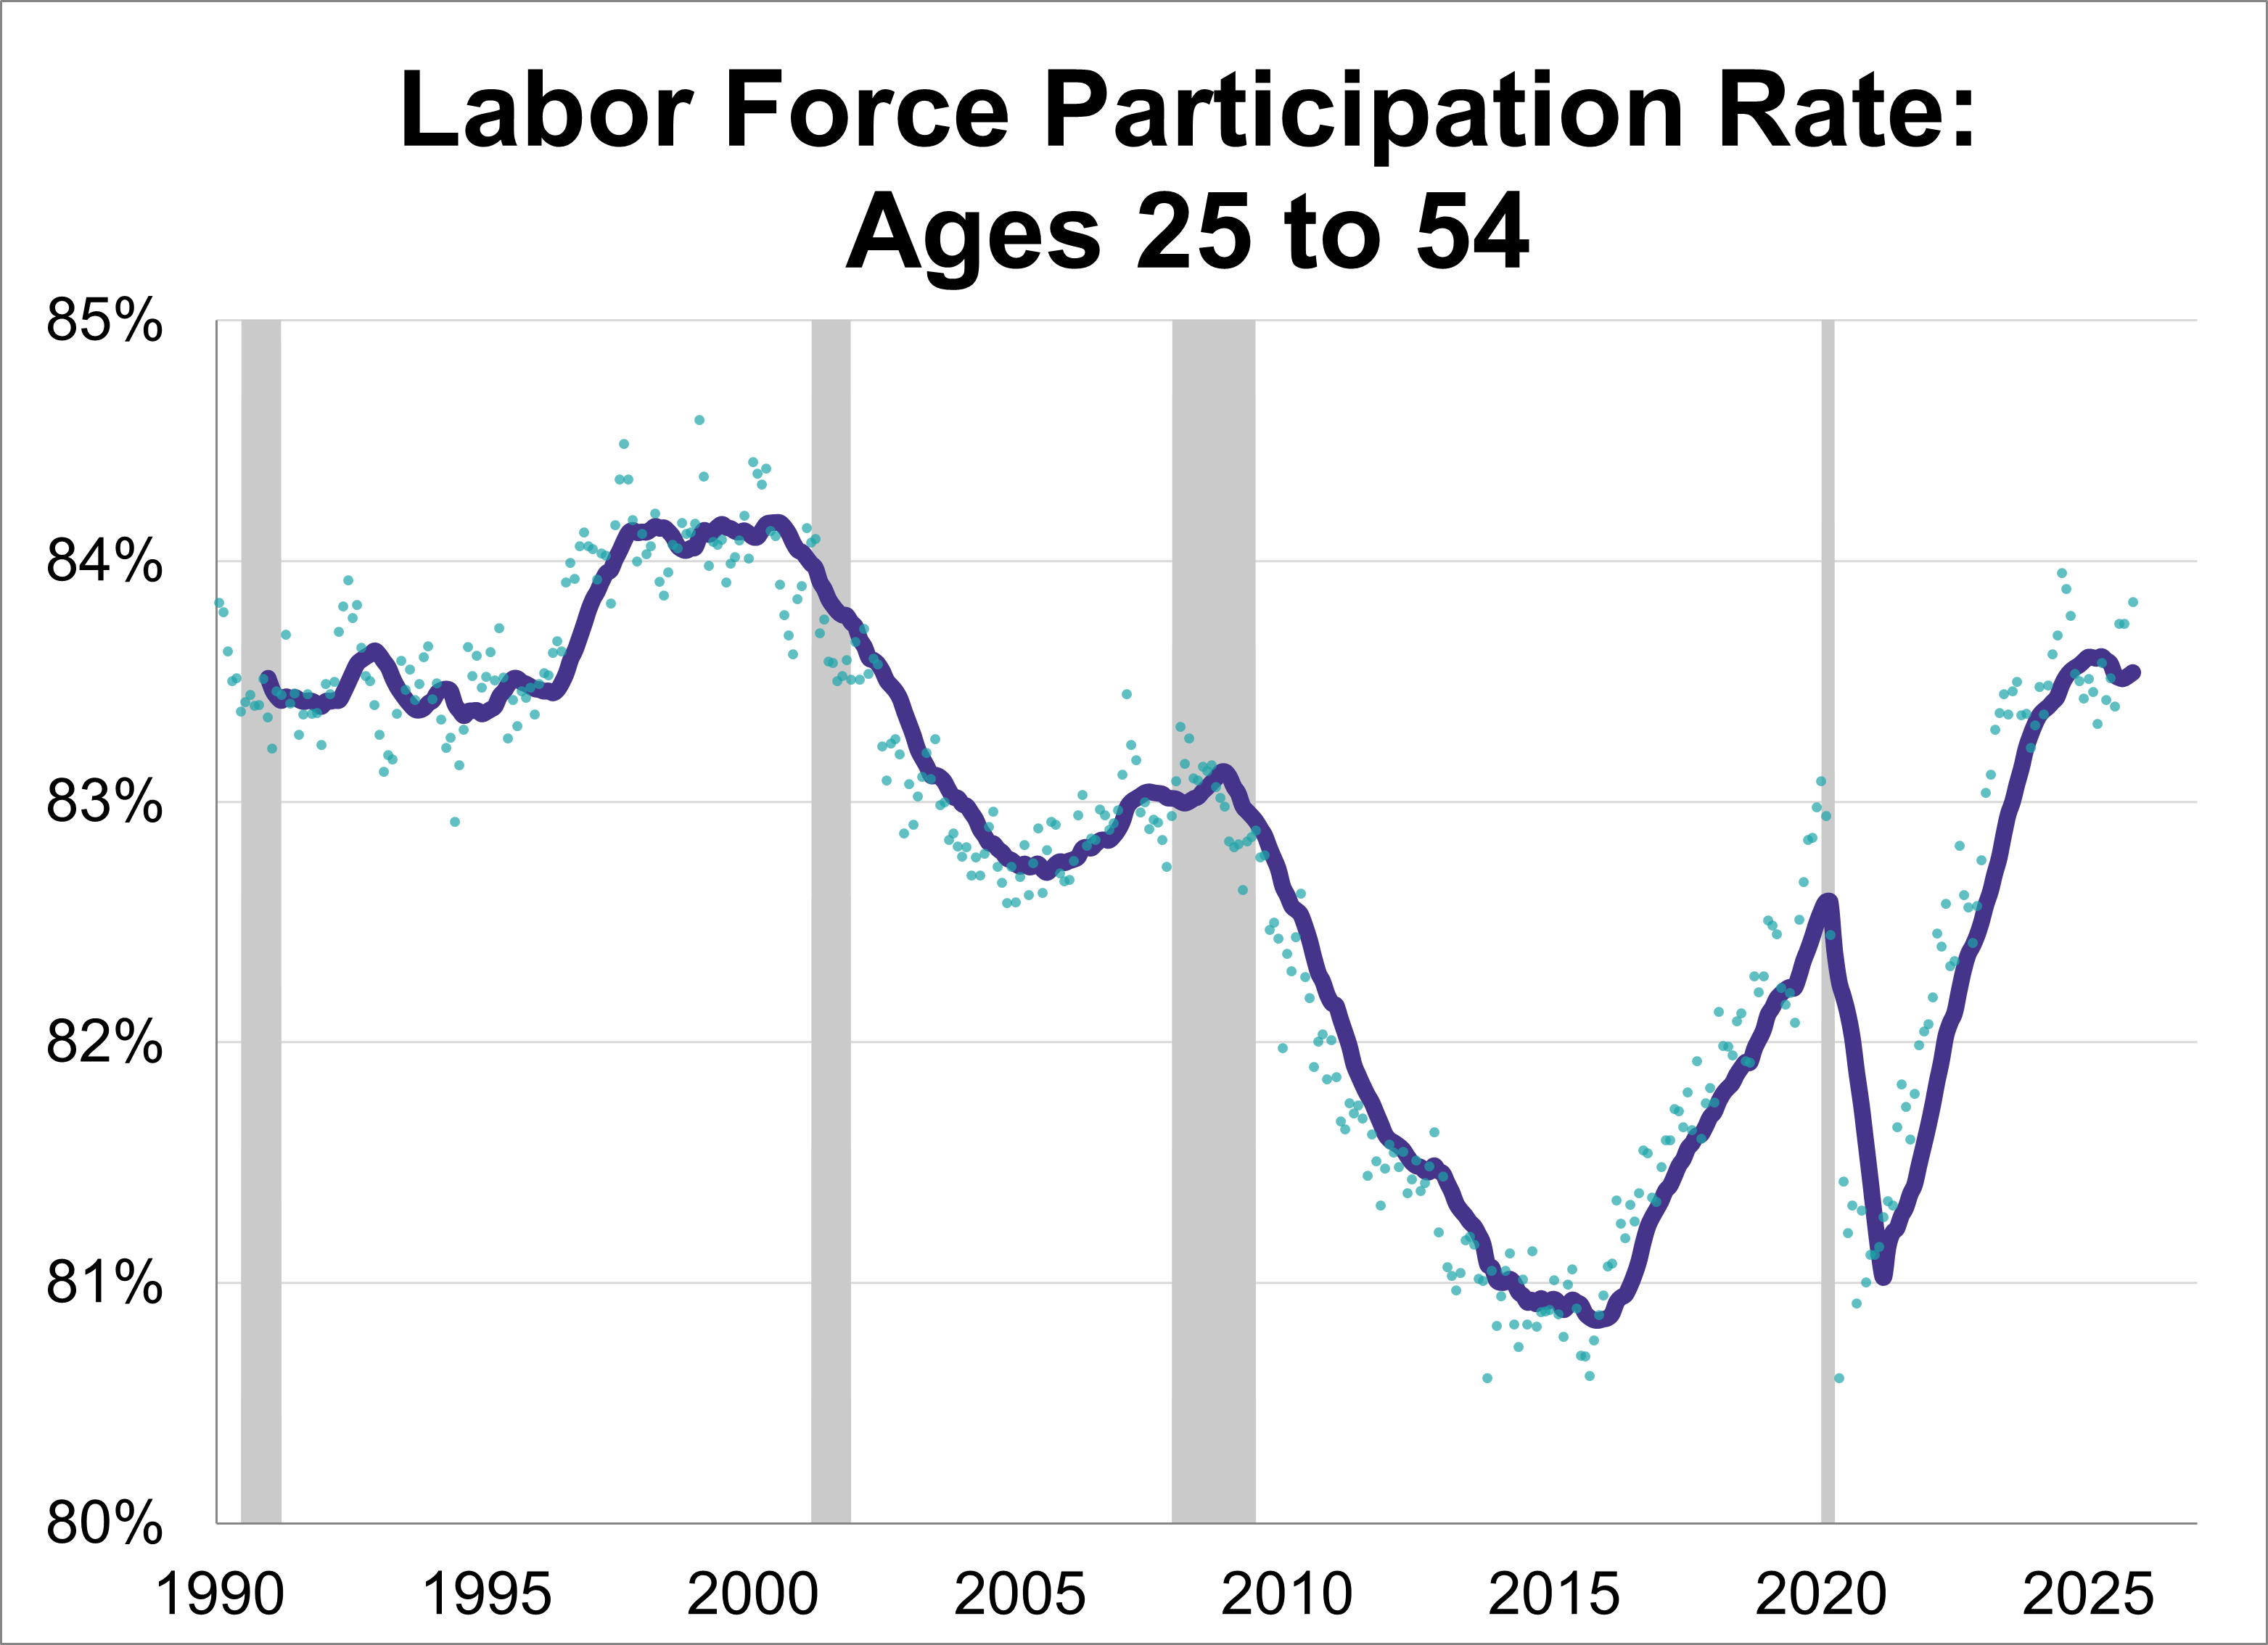
The labor force participation rate (LFPR) is a simple computation: You take the civilian labor force (people aged 16 and over employed or seeking employment) and divide it by the civilian non-institutional population (those 16 and over not in the military and or committed to an institution). As of September, the labor force participation rate is at 62.4%, up from 62.3% the previous month.
Last week's economic landscape was defined by conflicting signals from key indicators, suggesting a growing divergence between investor behavior and underlying consumer health.
Now that government workers are back in the office, the data flood is coming. Here are the four reports we’re most excited for, why they matter, and what we last heard from them.
Last week’s economic data sent mixed signals. Consumer sentiment plummeted to a near-record low on economic anxiety, and the manufacturing sector continued its long contraction.
Last week’s economic narrative centered around the Federal Reserve's latest rate cut, a decision complicated by the government shutdown and lack of economic data.
While the ongoing government shutdown continues to delay the release of many reports, a key piece of economic data managed to break through last week.
Secondary economic indicators have taken on heightened importance amid the ongoing government shutdown. Read through a handful of these secondary reports from the week of October 13th-18th.
In a week marked by renewed S&P 500 volatility stemming from reignited tariff talks and the ongoing challenge of a government shutdown that continues to delay crucial government reports, investors and analysts have increasingly turned to secondary economic indicators for a timely view of the U.S. economy.
In the absence of primary government indicators, policymakers and investors alike must turn to private sector releases to find clarity. These secondary reports paint a picture of a cooling labor market and an increasingly cautious consumer.
Last week’s economic data presented a sharp contradiction between a resilient U.S. economy and increasingly concerned American households.
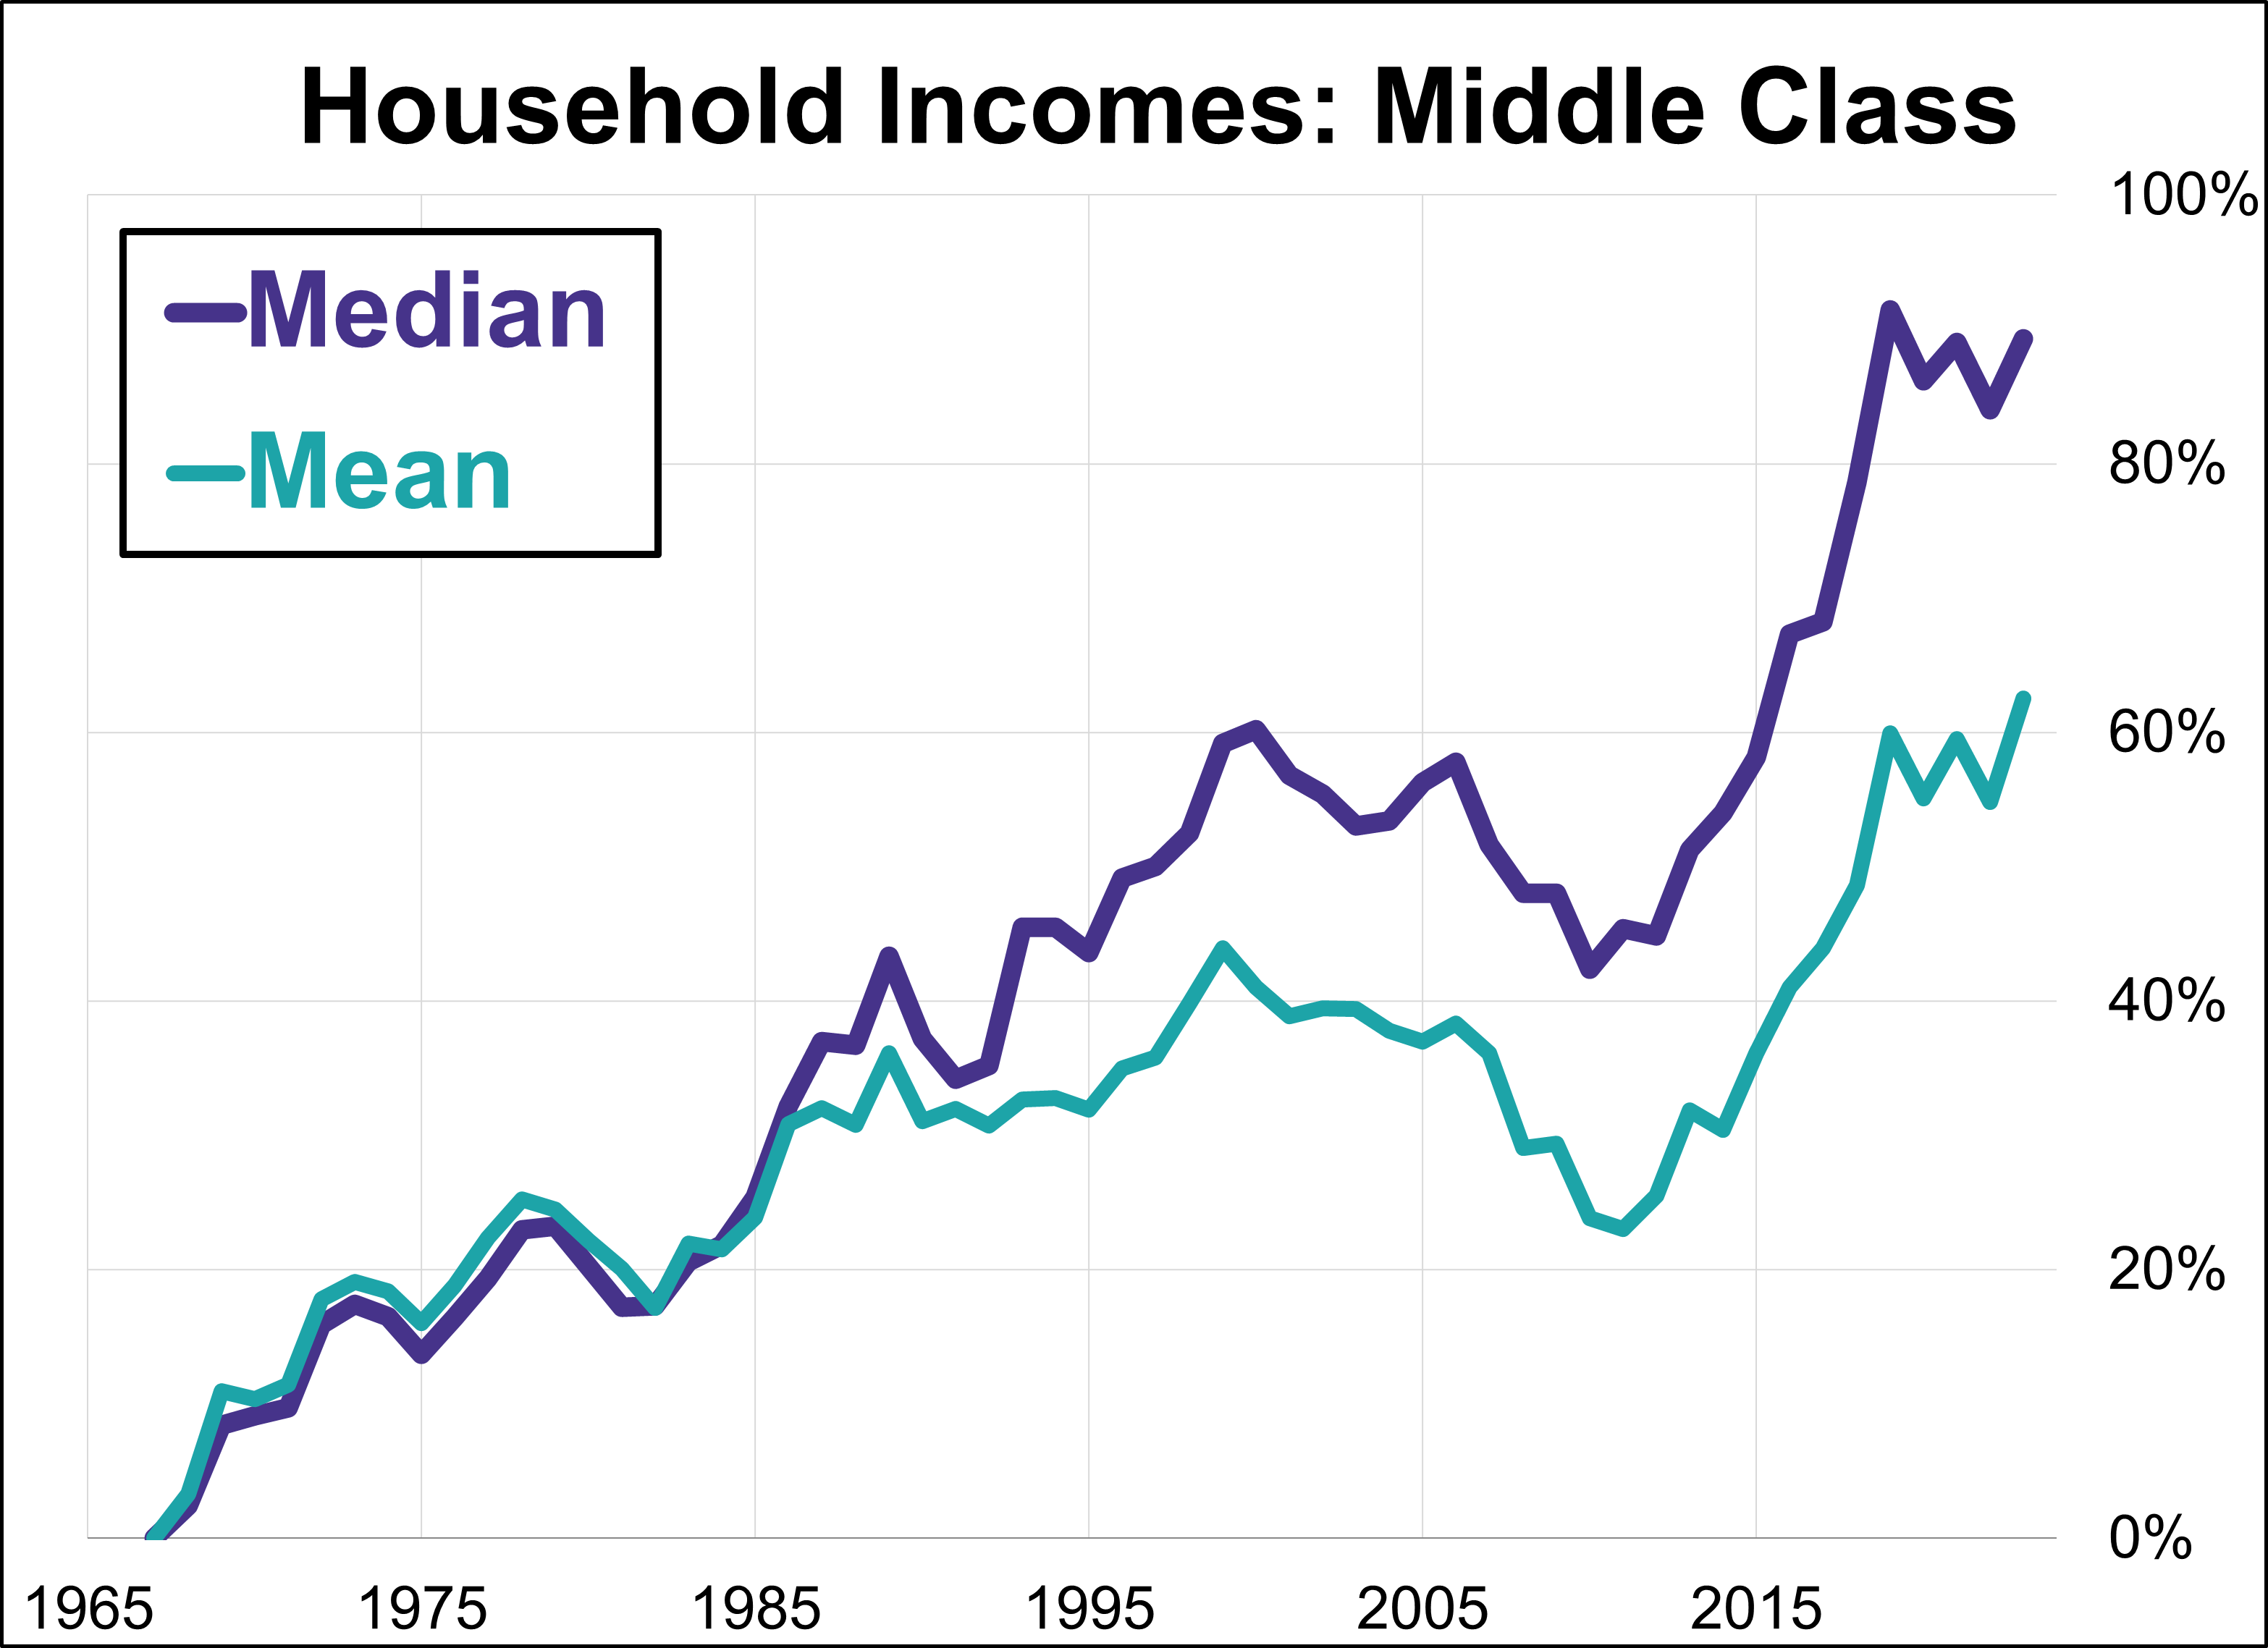
The median household is the statistical center of the Middle Class. Let's take a closer look at the Census Bureau's latest annual household income data with a focus on middle class income. In this update, we'll focus on the growing gap between the median (middle) and mean (average) household incomes across the complete time frame of the Census Bureau's annual reporting from 1867 to 2024.
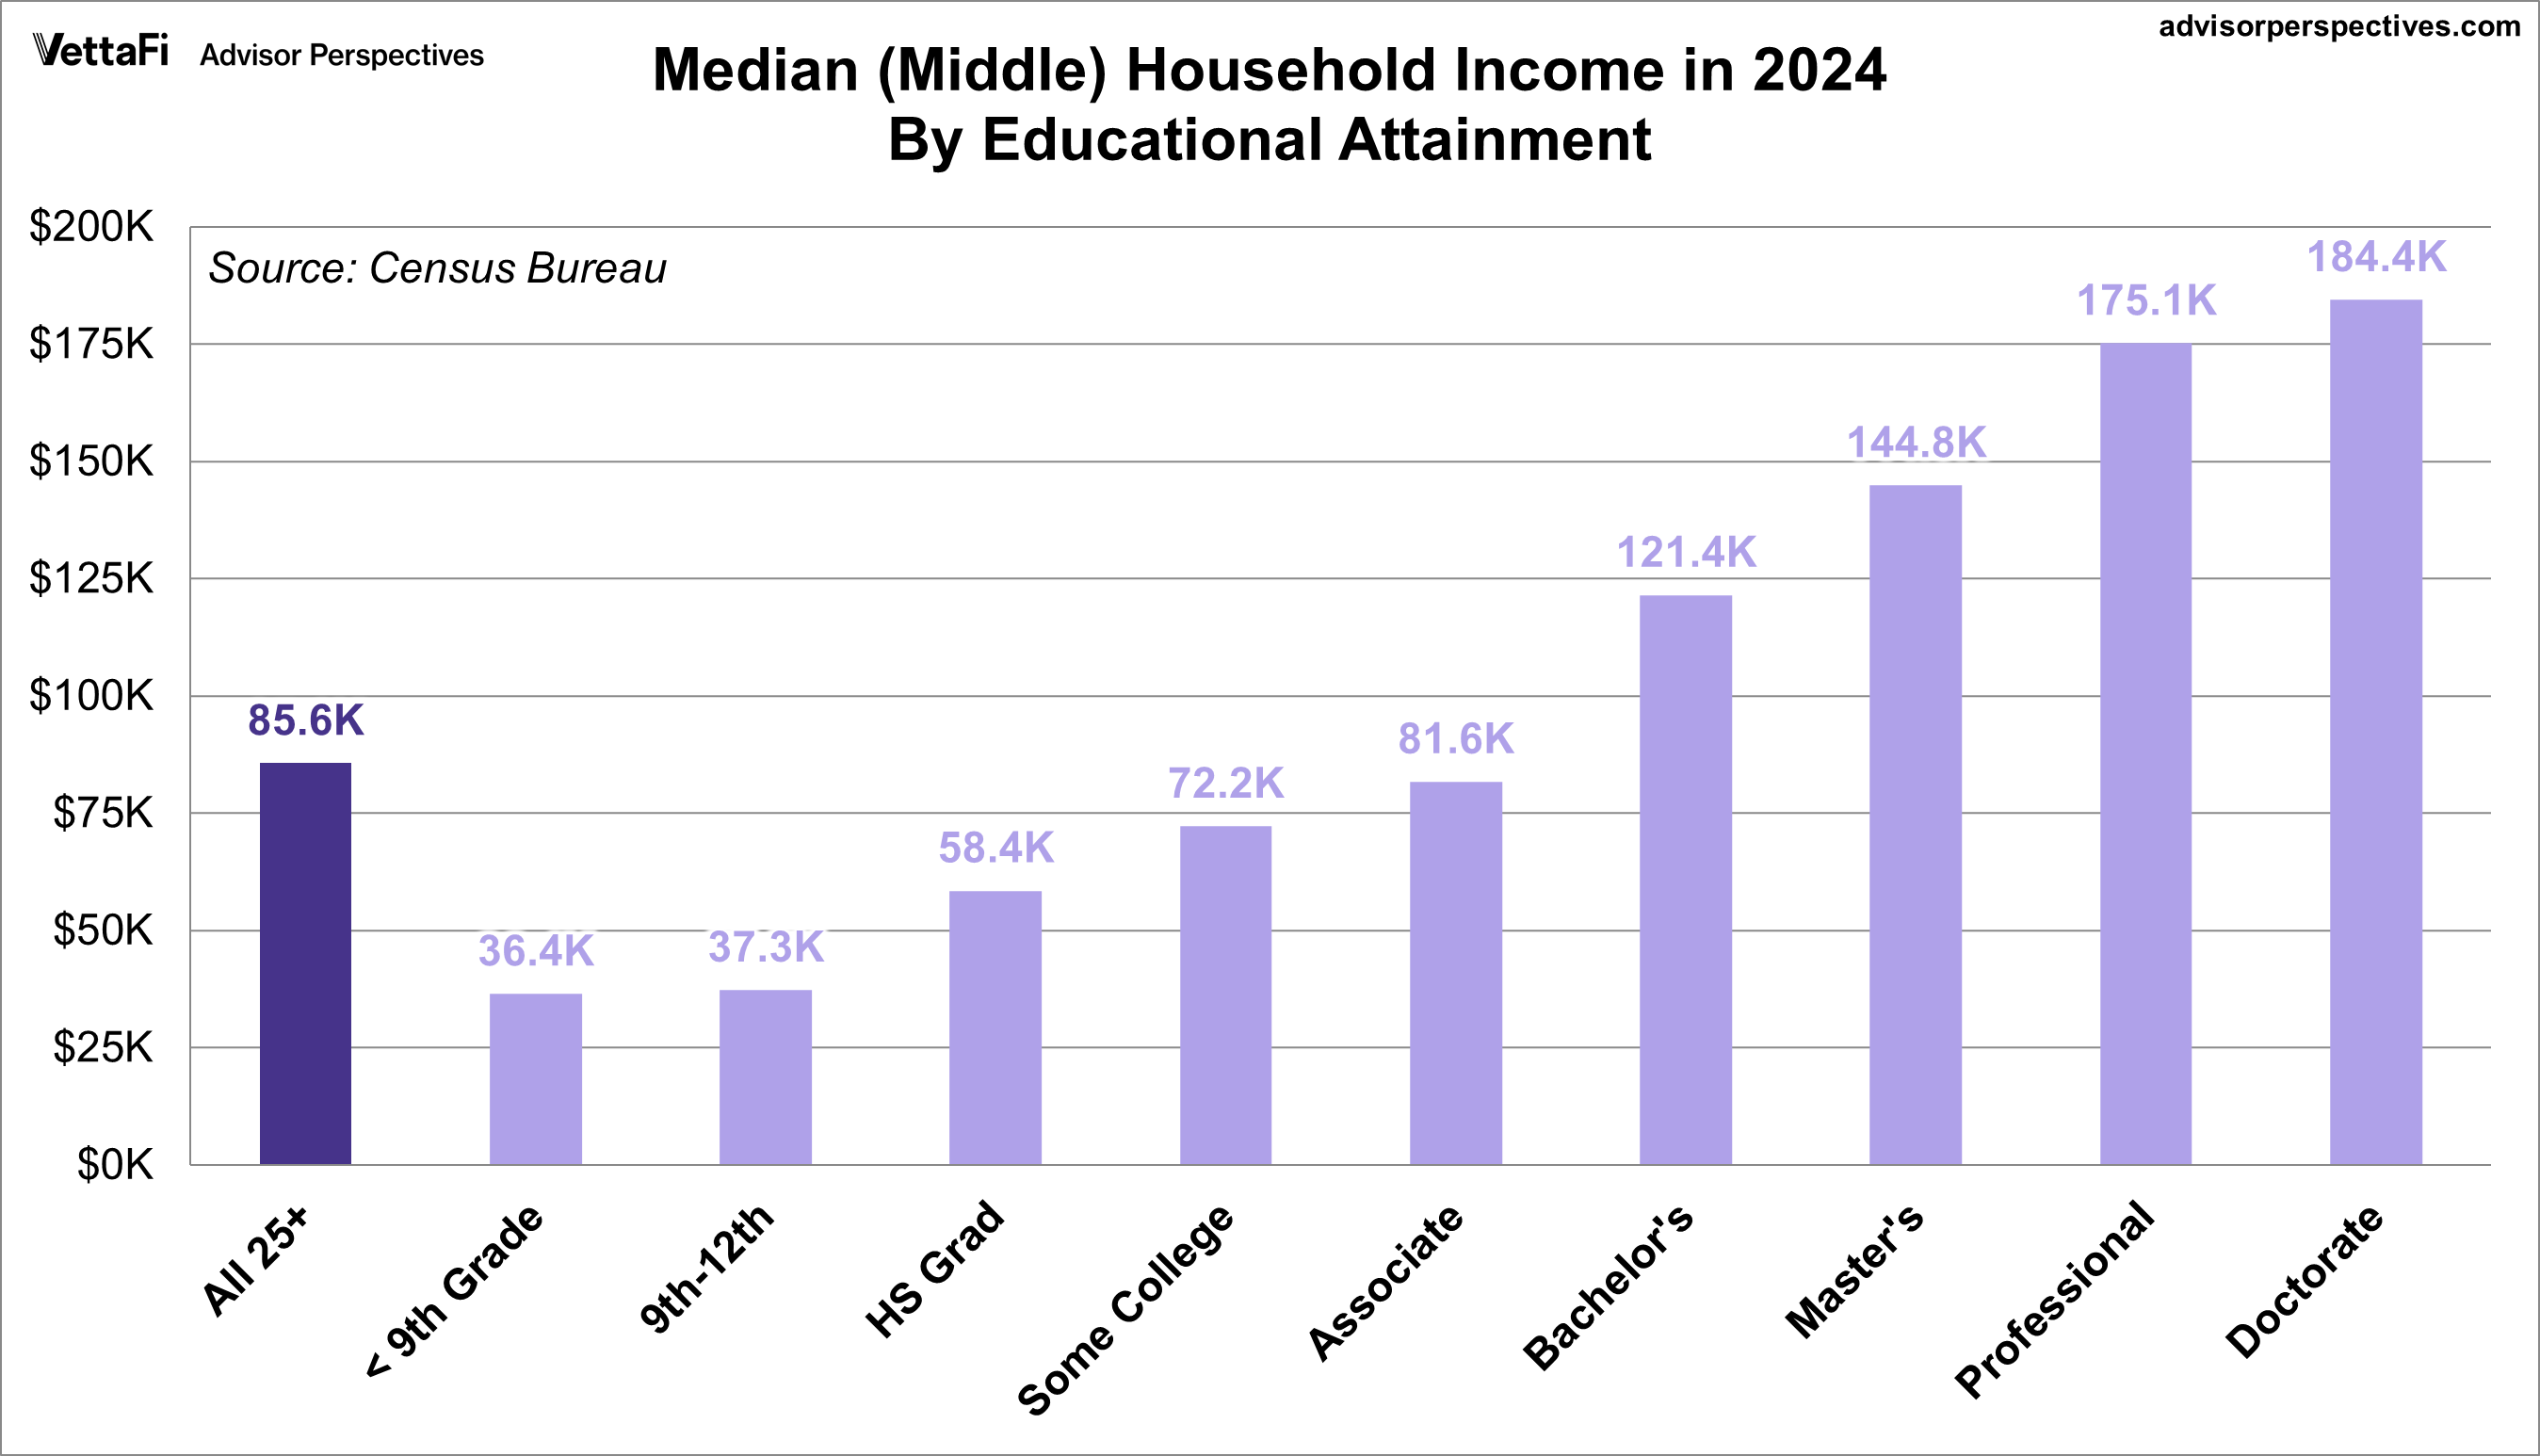
What is the relationship between education and household income? The Census Bureau’s 2024 annual survey data provides valuable insights into this question. The median household income for individuals aged 25 and older was $85,580, but how does this figure vary based on educational attainment?
Last week's economic data presented a challenging picture for the U.S. economy with key inflation reports delivering conflicting signals and a timely labor market indicator added to the narrative of a softening labor market. Read through the major economic news from the week of September 8th - 12th.
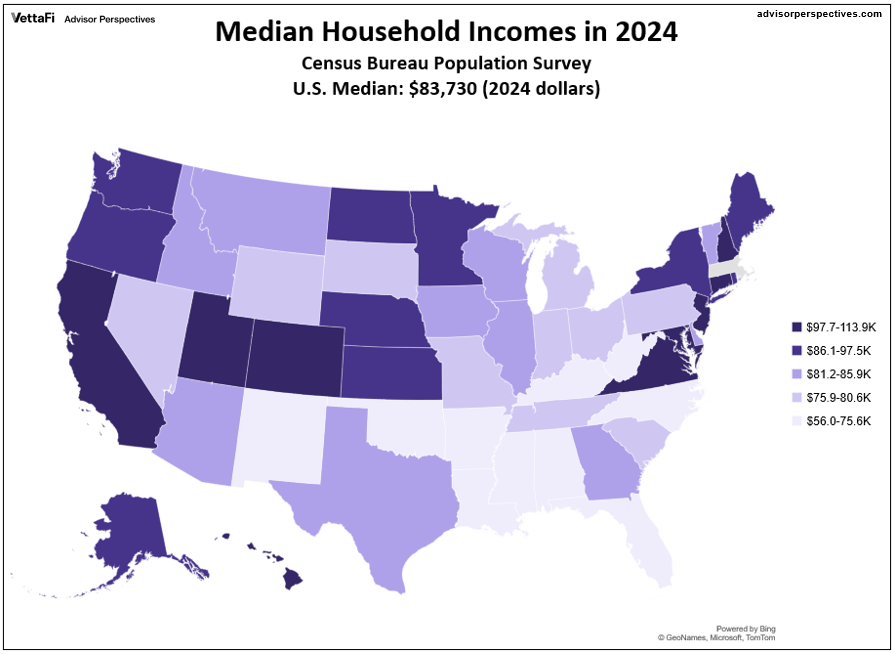
The median US income in 2024 was $83,730, up from $22,420 in 1984 — a 274% rise over the 40-year time frame. However, if we adjust for inflation chained in 2024 dollars, the 1984 median is $60.420 and the increase drops to 39%.
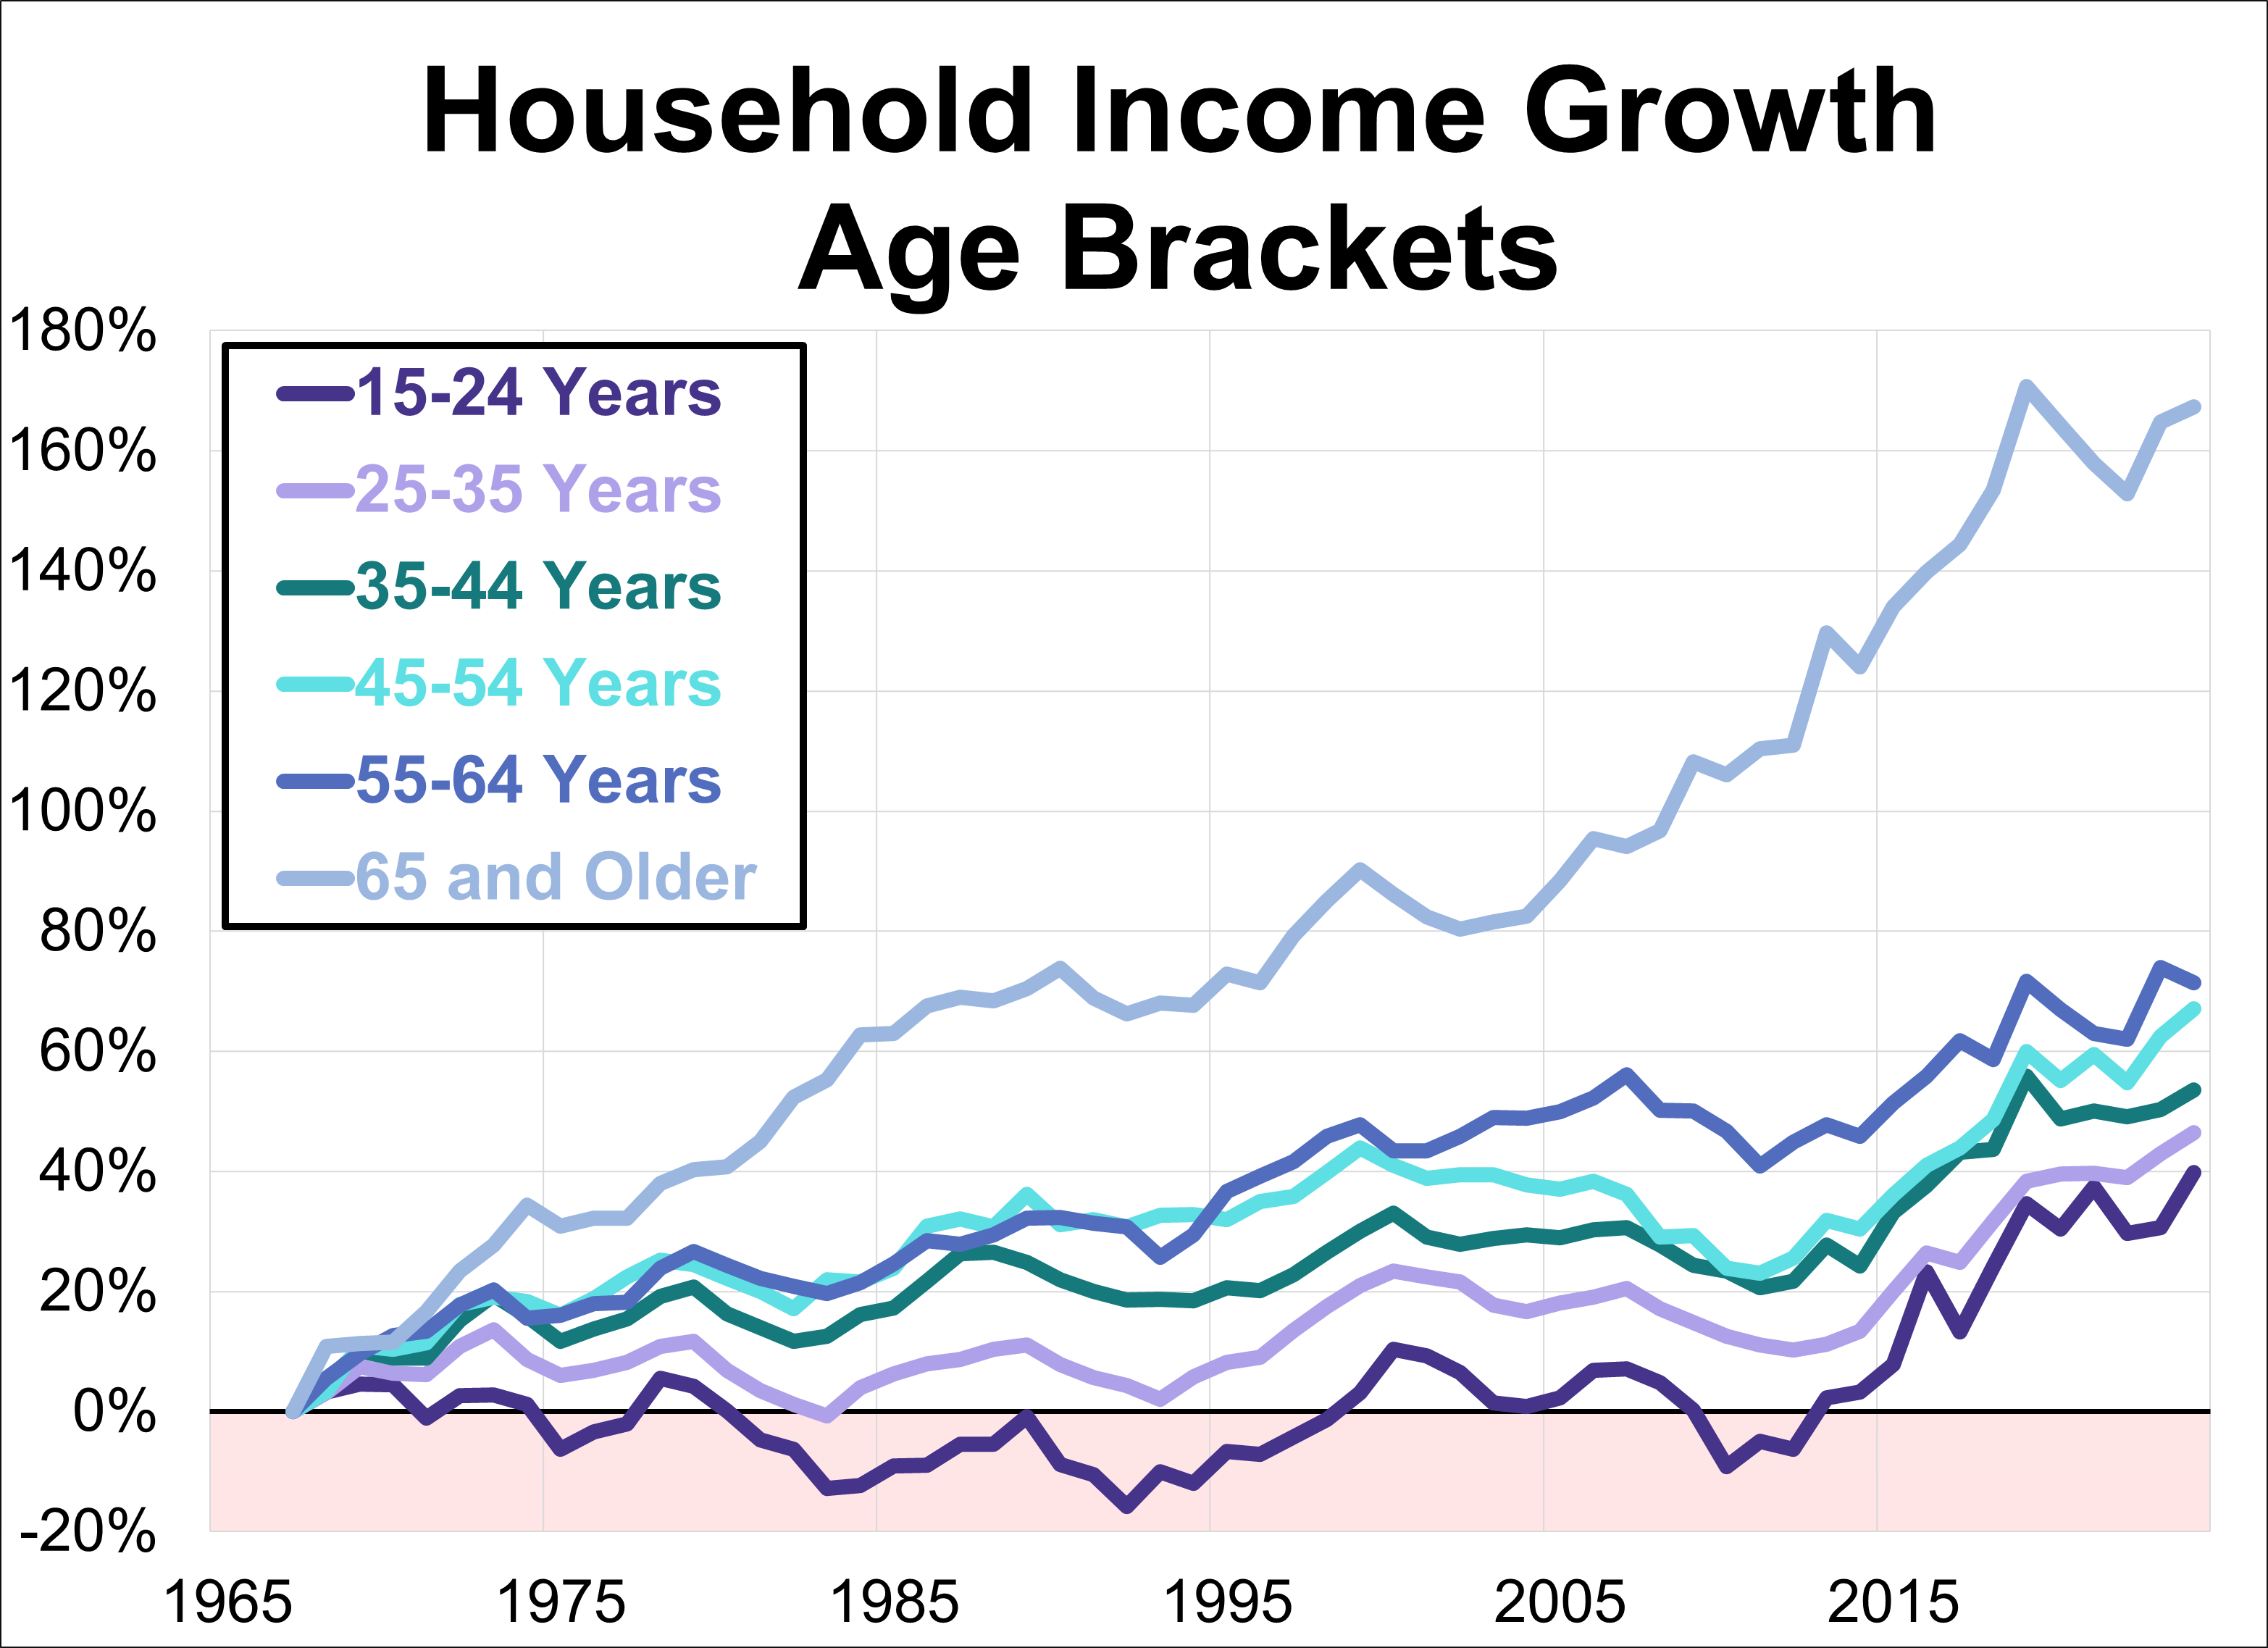
Our commentary on household income distribution offers some fascinating insights into average U.S. household incomes, but misses the implications of age for income. In this update, we examine household income with a focus on age bracket.
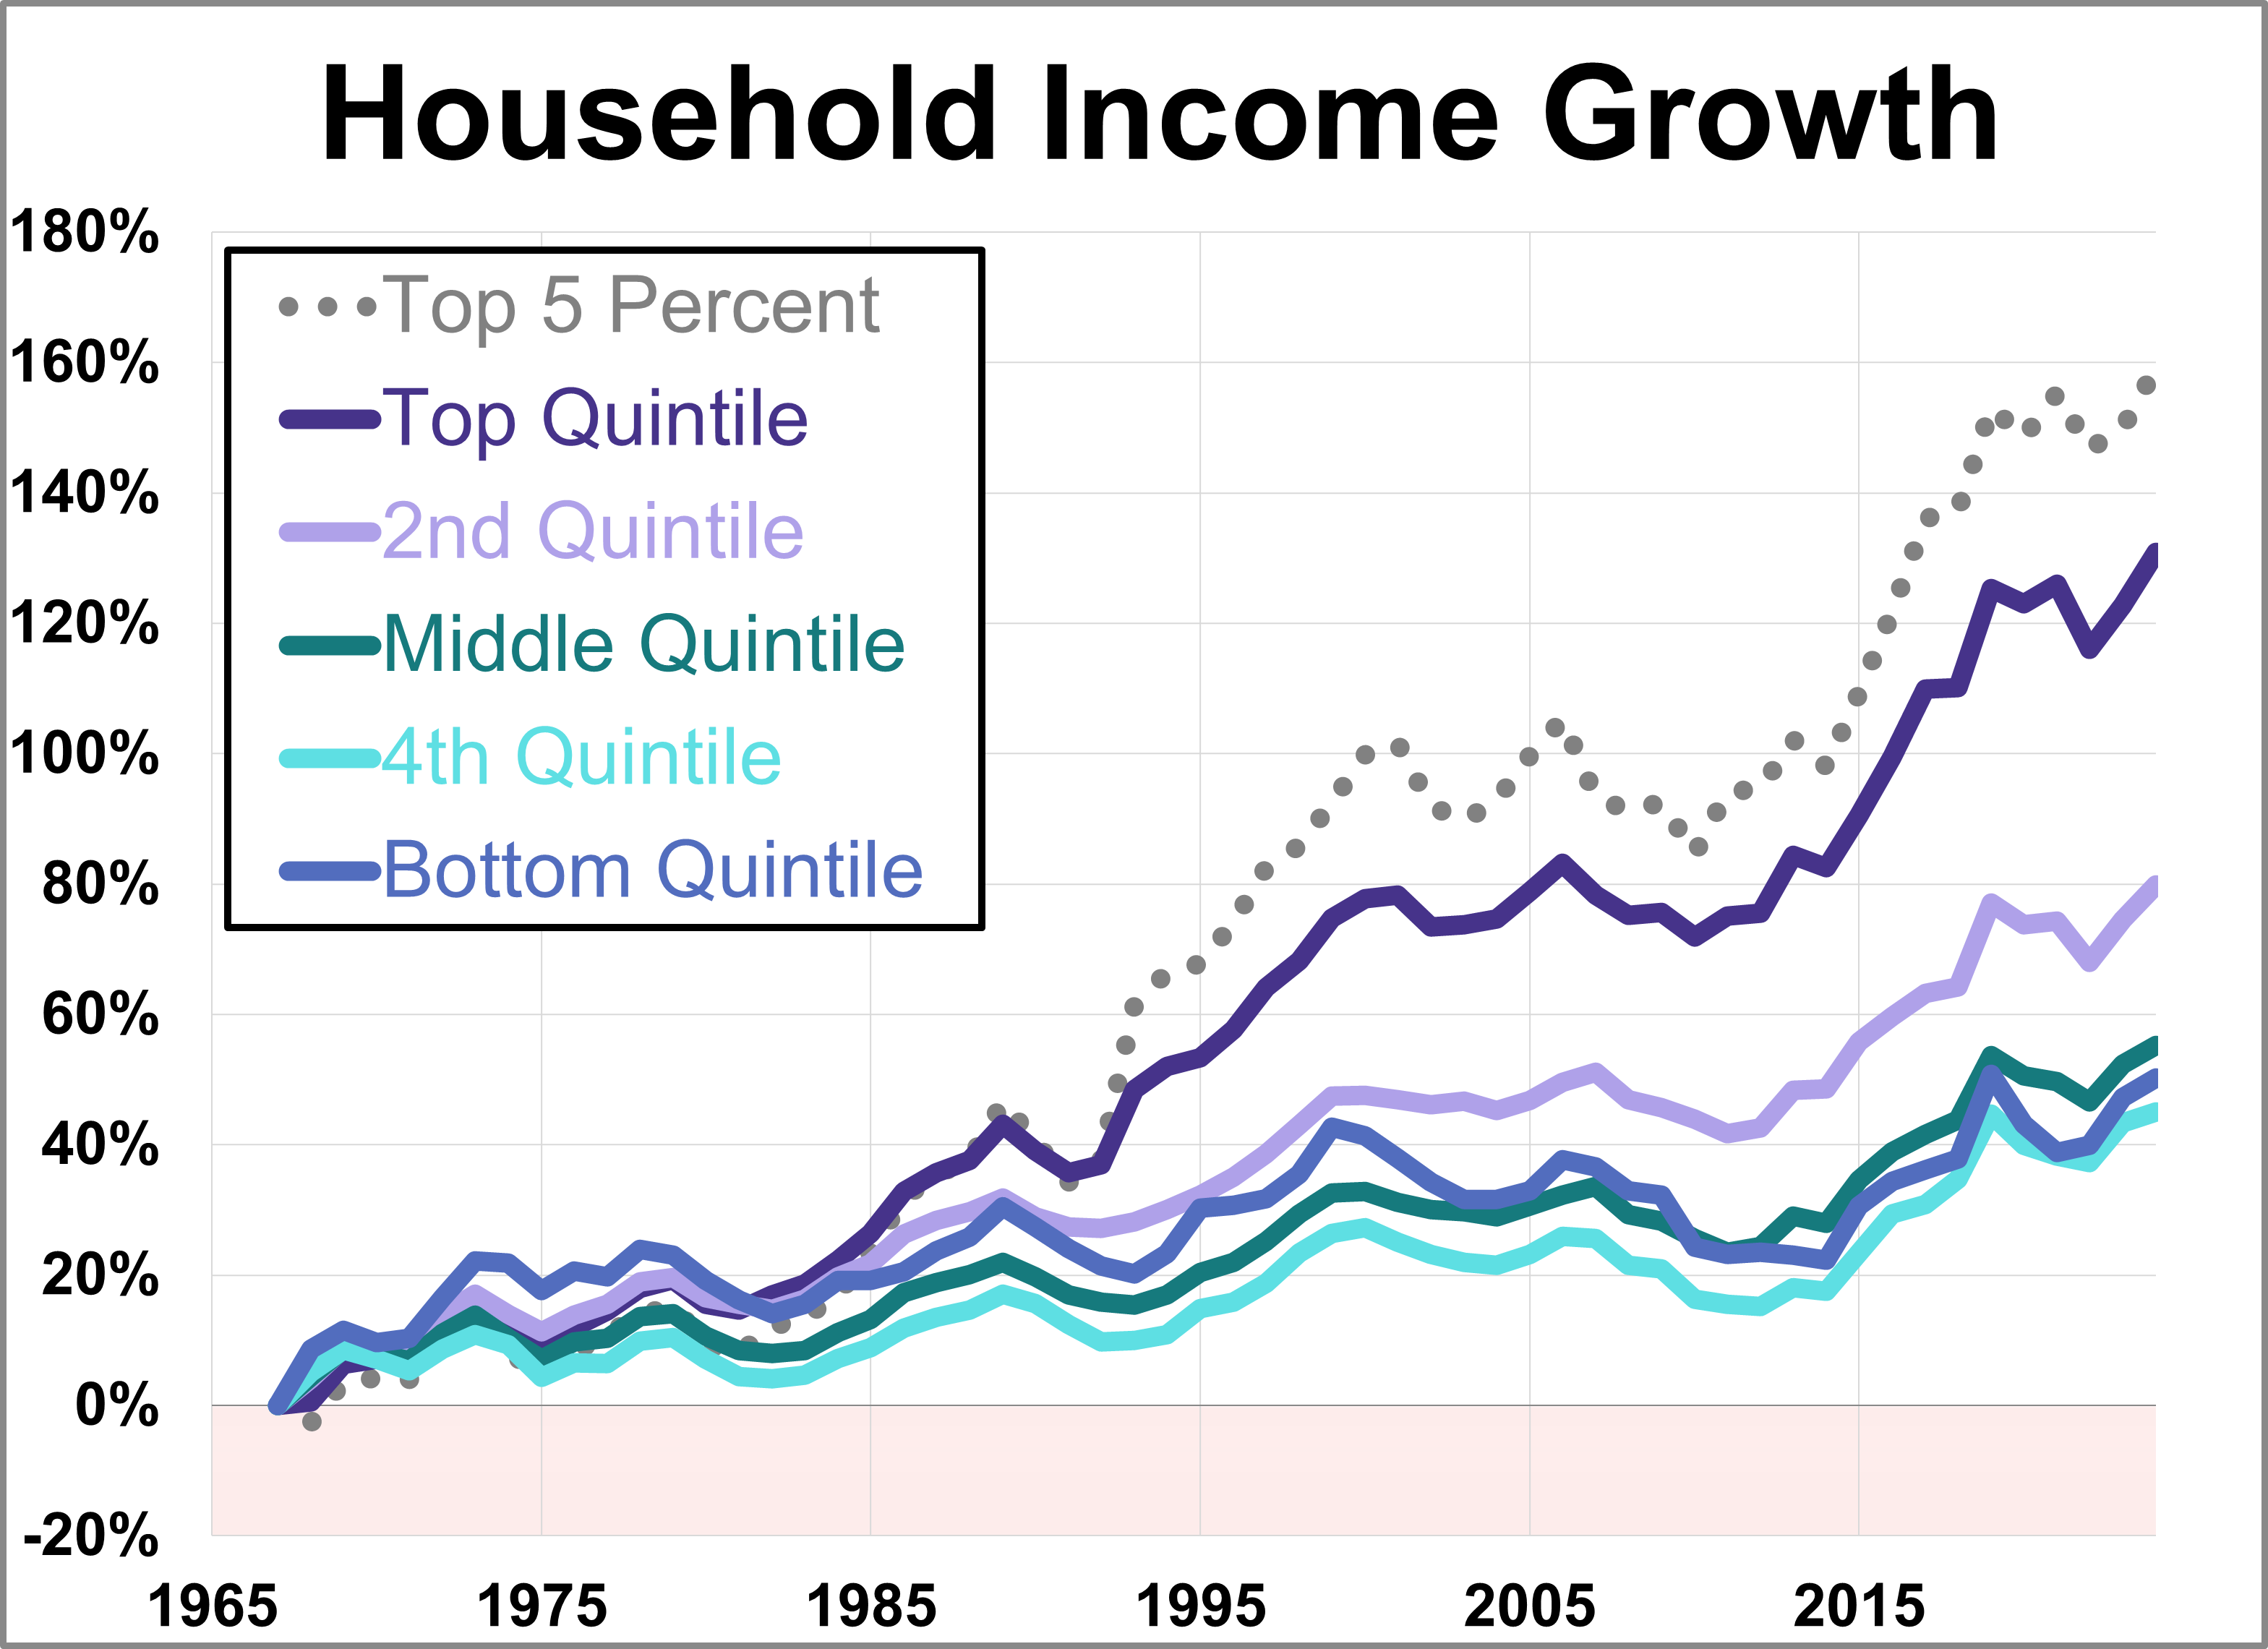
The Census Bureau recently released its annual report on household income data for 2024. The mean (average) household income for the middle quintile rose 4.5% to $84,390. Let's take a closer look at the quintile averages, which date back to 1967, along with the statistics for the top 5%.